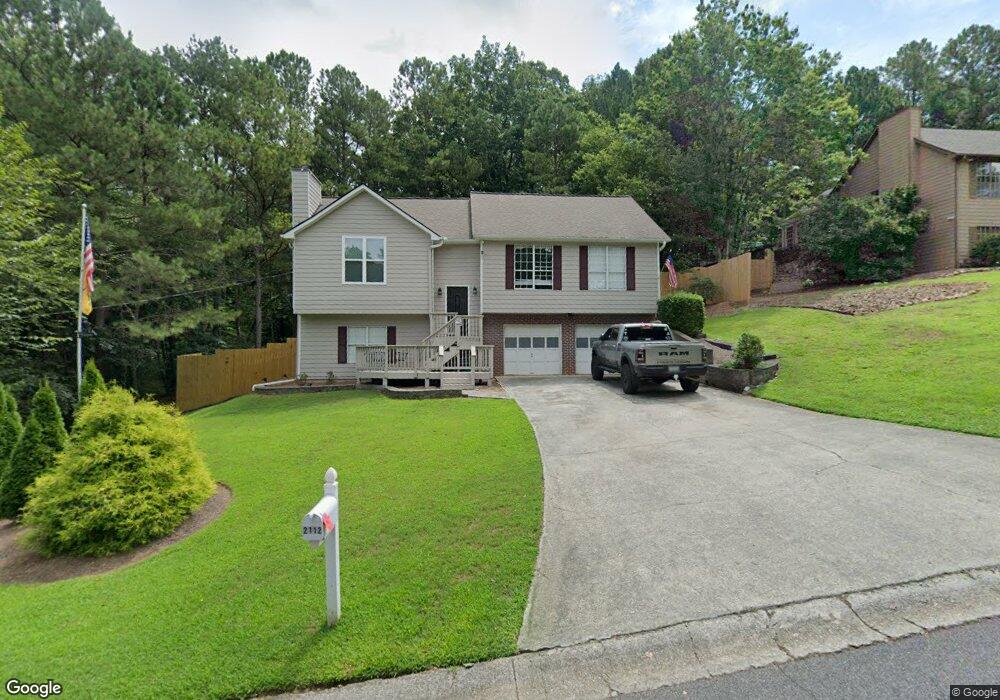
2112 Tourney Dr Marietta, GA 30062
Eastern Marietta NeighborhoodEstimated Value: $397,855 - $707,000
5
Beds
3
Baths
3,551
Sq Ft
$143/Sq Ft
Est. Value
About This Home
This home is located at 2112 Tourney Dr, Marietta, GA 30062 and is currently estimated at $508,964, approximately $143 per square foot. 2112 Tourney Dr is a home located in Cobb County with nearby schools including Kincaid Elementary School, Simpson Middle School, and Sprayberry High School.
Ownership History
Date
Name
Owned For
Owner Type
Purchase Details
Closed on
May 23, 2005
Sold by
Rhoden Bryasn G
Bought by
Rhoden Bryan G and Rhoden Sandra
Current Estimated Value
Home Financials for this Owner
Home Financials are based on the most recent Mortgage that was taken out on this home.
Original Mortgage
$175,500
Outstanding Balance
$90,918
Interest Rate
5.74%
Mortgage Type
New Conventional
Estimated Equity
$418,046
Purchase Details
Closed on
Oct 19, 2000
Sold by
Hicks Jeffrey B
Bought by
Rhoden Bryan G
Home Financials for this Owner
Home Financials are based on the most recent Mortgage that was taken out on this home.
Original Mortgage
$148,750
Interest Rate
7.93%
Mortgage Type
FHA
Purchase Details
Closed on
Mar 1, 1994
Sold by
Ascot Prop Inc
Bought by
Hicks Jeffrey B
Home Financials for this Owner
Home Financials are based on the most recent Mortgage that was taken out on this home.
Original Mortgage
$97,900
Interest Rate
7.47%
Purchase Details
Closed on
Sep 7, 1993
Sold by
Johns Buel
Bought by
Ascot Prop Inc
Create a Home Valuation Report for This Property
The Home Valuation Report is an in-depth analysis detailing your home's value as well as a comparison with similar homes in the area
Home Values in the Area
Average Home Value in this Area
Purchase History
| Date | Buyer | Sale Price | Title Company |
|---|---|---|---|
| Rhoden Bryan G | -- | -- | |
| Rhoden Bryan G | $150,000 | -- | |
| Hicks Jeffrey B | $103,100 | -- | |
| Ascot Prop Inc | $12,500 | -- |
Source: Public Records
Mortgage History
| Date | Status | Borrower | Loan Amount |
|---|---|---|---|
| Open | Rhoden Bryan G | $175,500 | |
| Previous Owner | Rhoden Bryan G | $148,750 | |
| Previous Owner | Hicks Jeffrey B | $97,900 |
Source: Public Records
Tax History Compared to Growth
Tax History
| Year | Tax Paid | Tax Assessment Tax Assessment Total Assessment is a certain percentage of the fair market value that is determined by local assessors to be the total taxable value of land and additions on the property. | Land | Improvement |
|---|---|---|---|---|
| 2025 | $3,576 | $152,928 | $38,000 | $114,928 |
| 2024 | $3,512 | $149,792 | $38,000 | $111,792 |
| 2023 | $2,824 | $143,136 | $32,000 | $111,136 |
| 2022 | $2,745 | $113,500 | $26,800 | $86,700 |
| 2021 | $2,745 | $113,500 | $26,800 | $86,700 |
| 2020 | $2,466 | $100,732 | $24,800 | $75,932 |
| 2019 | $2,053 | $81,900 | $16,000 | $65,900 |
| 2018 | $2,053 | $81,900 | $16,000 | $65,900 |
| 2017 | $1,873 | $77,440 | $14,000 | $63,440 |
| 2016 | $1,787 | $73,448 | $14,000 | $59,448 |
| 2015 | $1,830 | $73,448 | $14,000 | $59,448 |
| 2014 | $1,529 | $60,308 | $0 | $0 |
Source: Public Records
Map
Nearby Homes
- 2072 Fairport Way
- 2265 Piedmont Glen Ct Unit 1
- 2020 Starlight Dr
- 2255 Abbey Cove Ct
- 1991 Kinridge Rd
- 2065 Mozelle Dr
- 2289 Glenridge Dr
- 2301 Piedmont Forest Dr
- 2153 Deep Woods Way
- 2295 Piedmont Ridge Ct
- 2161 Deep Woods Way Unit 3
- 2314 Sandy Oaks Dr
- 2451 Cedar Fork Trail Unit 5
- 1833 Tree Top Ct
- 1822 Hasty Rd
- 1780 Kinridge Rd
- 2511 Waterstone Way
- 2346 Jomarc Way
- 2102 Tourney Dr
- 2132 Tourney Dr
- 2113 Tourney Dr
- 2123 Tourney Dr
- 2011 Trophy Dr
- 2112 Plymouth Ln
- 2133 Tourney Dr
- 2142 Tourney Dr
- 2111 Plymouth Ln
- 2082 Tourney Dr
- 2143 Tourney Dr
- 2111 E Piedmont Rd
- 2124 Plymouth Ln
- 2110 Spalding Dr
- 2120 Spalding Dr
- 2123 Plymouth Ln Unit 10
- 2123 Plymouth Ln
- 2010 Trophy Dr
- 1991 Trophy Dr
- 2130 Spalding Dr