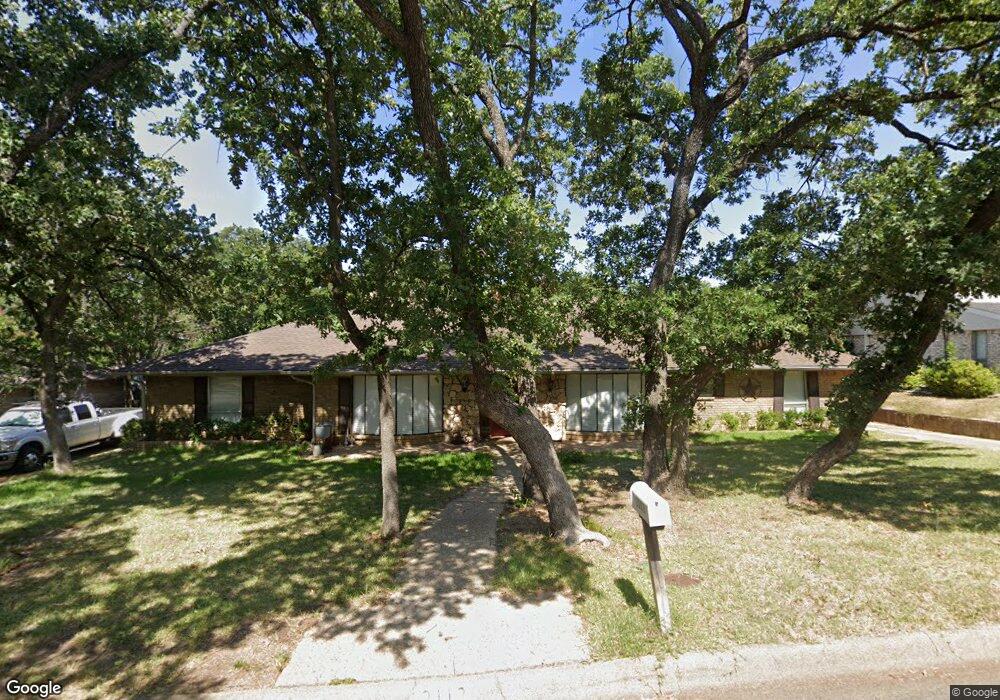
2112 Woodbrook St Denton, TX 76205
South Denton NeighborhoodEstimated Value: $531,495 - $666,000
4
Beds
4
Baths
3,441
Sq Ft
$168/Sq Ft
Est. Value
About This Home
This home is located at 2112 Woodbrook St, Denton, TX 76205 and is currently estimated at $578,624, approximately $168 per square foot. 2112 Woodbrook St is a home located in Denton County with nearby schools including Houston Elementary School, McMath Middle School, and Denton High School.
Ownership History
Date
Name
Owned For
Owner Type
Purchase Details
Closed on
Jul 19, 2010
Sold by
Kueles Leo
Bought by
Frank Thomas K and Frank Jessalyn M
Current Estimated Value
Home Financials for this Owner
Home Financials are based on the most recent Mortgage that was taken out on this home.
Original Mortgage
$160,000
Outstanding Balance
$106,375
Interest Rate
4.73%
Mortgage Type
New Conventional
Estimated Equity
$472,249
Purchase Details
Closed on
Aug 31, 2006
Sold by
Settle Marti S
Bought by
Kuelbs Leo
Purchase Details
Closed on
Dec 28, 1998
Sold by
Dees Shirley Herrington
Bought by
Settle Marti S
Home Financials for this Owner
Home Financials are based on the most recent Mortgage that was taken out on this home.
Original Mortgage
$153,000
Interest Rate
6.85%
Create a Home Valuation Report for This Property
The Home Valuation Report is an in-depth analysis detailing your home's value as well as a comparison with similar homes in the area
Home Values in the Area
Average Home Value in this Area
Purchase History
| Date | Buyer | Sale Price | Title Company |
|---|---|---|---|
| Frank Thomas K | -- | None Available | |
| Kuelbs Leo | -- | None Available | |
| Settle Marti S | -- | -- |
Source: Public Records
Mortgage History
| Date | Status | Borrower | Loan Amount |
|---|---|---|---|
| Open | Frank Thomas K | $160,000 | |
| Previous Owner | Settle Marti S | $153,000 |
Source: Public Records
Tax History Compared to Growth
Tax History
| Year | Tax Paid | Tax Assessment Tax Assessment Total Assessment is a certain percentage of the fair market value that is determined by local assessors to be the total taxable value of land and additions on the property. | Land | Improvement |
|---|---|---|---|---|
| 2025 | $3,415 | $465,943 | $113,819 | $352,124 |
| 2024 | $9,345 | $484,152 | $113,819 | $370,333 |
| 2023 | $3,424 | $467,035 | $113,819 | $365,888 |
| 2022 | $9,013 | $424,577 | $100,429 | $368,548 |
| 2021 | $8,580 | $385,979 | $66,953 | $319,026 |
| 2020 | $8,362 | $365,833 | $66,953 | $298,880 |
| 2019 | $8,801 | $368,833 | $66,953 | $301,880 |
| 2018 | $8,597 | $355,889 | $66,953 | $288,936 |
| 2017 | $8,046 | $325,538 | $66,953 | $260,731 |
| 2016 | $7,315 | $295,944 | $66,953 | $230,013 |
| 2015 | $5,205 | $269,040 | $66,953 | $204,468 |
| 2014 | $5,205 | $244,582 | $76,083 | $168,499 |
| 2013 | -- | $249,923 | $76,083 | $173,840 |
Source: Public Records
Map
Nearby Homes
- 2012 Hollyhill Ln
- 2100 Fairfax Rd
- 2120 Fairfax Rd
- 412 Hollyhill Ln Unit 412
- 408 Hollyhill Ln
- 2216 Jefferson Trail
- 2218 Southridge Dr
- 924 Ridgecrest Cir
- 2226 Savannah Trail
- 1000 Lynhurst Ln
- 209 Pennsylvania Dr
- 829 Skylark Dr
- 821 Sandpiper Dr
- 1412 Ridgecrest Cir
- 824 Sandpiper Dr
- 2253 Hollyhill Ln
- 916 Smokerise Cir
- 816 Chapel Dr
- 2272 Hollyhill Ln
- 1012 Indian Ridge Dr
- 2116 Woodbrook St
- 2108 Woodbrook St
- 2113 Pembrooke Place
- 2117 Pembrooke Place
- 2109 Pembrooke Place
- 2120 Woodbrook St
- 2104 Woodbrook St
- 2113 Woodbrook St
- 2117 Woodbrook St
- 2109 Woodbrook St
- 2121 Woodbrook St
- 2121 Pembrooke Place
- 2124 Woodbrook St
- 2105 Pembrooke Place
- 2100 Woodbrook St
- 2105 Woodbrook St
- 2112 Pembrooke Place
- 916 Chasewood Ln
- 2116 Pembrooke Place
- 2125 Woodbrook St