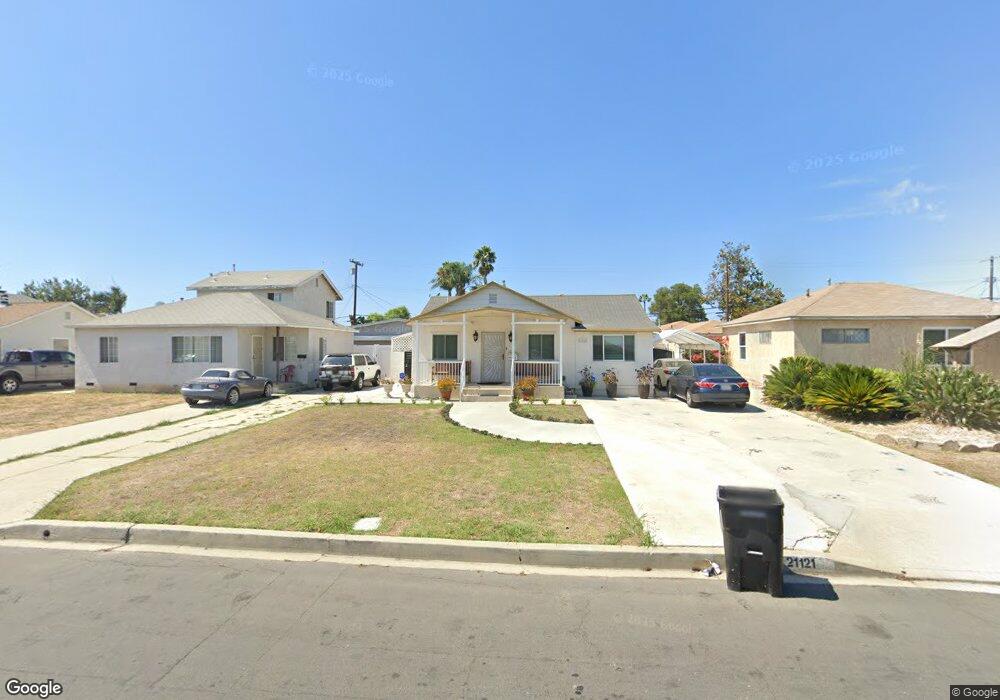
21121 Denker Ave Torrance, CA 90501
Harbor Gateway NeighborhoodEstimated Value: $779,000 - $876,000
4
Beds
2
Baths
1,407
Sq Ft
$594/Sq Ft
Est. Value
About This Home
This home is located at 21121 Denker Ave, Torrance, CA 90501 and is currently estimated at $835,084, approximately $593 per square foot. 21121 Denker Ave is a home located in Los Angeles County with nearby schools including Halldale Elementary School, Stephen M. White Middle School, and Nathaniel Narbonne Senior High School.
Ownership History
Date
Name
Owned For
Owner Type
Purchase Details
Closed on
May 17, 2019
Sold by
Tran Thuan Trung and Dang Thuy Thanh Thi
Bought by
The Tran Dang Living Trust
Current Estimated Value
Purchase Details
Closed on
Mar 18, 2009
Sold by
Perez Gustavo P and Perez Sara
Bought by
Tran Thuan Trung
Purchase Details
Closed on
Oct 26, 1995
Sold by
Va
Bought by
Perez Gustavo P
Home Financials for this Owner
Home Financials are based on the most recent Mortgage that was taken out on this home.
Original Mortgage
$161,000
Interest Rate
7.58%
Mortgage Type
Seller Take Back
Purchase Details
Closed on
Sep 15, 1994
Sold by
Associates National Mtg Corp
Bought by
Va
Purchase Details
Closed on
Sep 8, 1994
Sold by
Petraroia Michael and Petraroia Linda
Bought by
Associates National Mtg Corp
Create a Home Valuation Report for This Property
The Home Valuation Report is an in-depth analysis detailing your home's value as well as a comparison with similar homes in the area
Home Values in the Area
Average Home Value in this Area
Purchase History
| Date | Buyer | Sale Price | Title Company |
|---|---|---|---|
| The Tran Dang Living Trust | -- | None Available | |
| Tran Thuan Trung | $339,000 | American Coast Title Co Inc | |
| Perez Gustavo P | $161,000 | -- | |
| Va | -- | Benefit Land Title | |
| Associates National Mtg Corp | $148,756 | World Title Company |
Source: Public Records
Mortgage History
| Date | Status | Borrower | Loan Amount |
|---|---|---|---|
| Previous Owner | Perez Gustavo P | $161,000 |
Source: Public Records
Tax History Compared to Growth
Tax History
| Year | Tax Paid | Tax Assessment Tax Assessment Total Assessment is a certain percentage of the fair market value that is determined by local assessors to be the total taxable value of land and additions on the property. | Land | Improvement |
|---|---|---|---|---|
| 2025 | $5,566 | $436,535 | $349,233 | $87,302 |
| 2024 | $5,566 | $427,977 | $342,386 | $85,591 |
| 2023 | $5,460 | $419,586 | $335,673 | $83,913 |
| 2022 | $5,215 | $411,360 | $329,092 | $82,268 |
| 2021 | $5,145 | $403,295 | $322,640 | $80,655 |
| 2020 | $5,191 | $399,160 | $319,332 | $79,828 |
| 2019 | $4,993 | $391,334 | $313,071 | $78,263 |
| 2018 | $4,848 | $383,662 | $306,933 | $76,729 |
| 2016 | $4,622 | $368,765 | $295,015 | $73,750 |
| 2015 | $4,552 | $363,227 | $290,584 | $72,643 |
| 2014 | $4,567 | $356,113 | $284,892 | $71,221 |
Source: Public Records
Map
Nearby Homes
- 21114 La Salle Ave
- 20907 Halldale Ave
- 1601 Torrance Blvd
- 1566 W 208th St
- 21322 Denker Ave
- 21125 Normandie Ave
- 1514 W 207th St Unit C
- 20813 Normandie Ave
- 1629 W 208th St
- 1668 W 213th St
- 1667 W 208th St
- 1636 W 205th St
- 1654 W 216th St
- 1107 W 210th St
- 20612 Kenwood Ave
- 20315 Denker Ave Unit 28
- 1291 Bonnet Way
- 21726 Halldale Ave
- 1569 W 218th St
- 20710 Raymond Ave
- 21115 Denker Ave
- 21129 Denker Ave
- 21117 Denker Ave
- 21133 Denker Ave
- 21113 Denker Ave
- 21107 Denker Ave
- 21139 Denker Ave
- 21120 La Salle Ave
- 21124 La Salle Ave
- 21130 La Salle Ave
- 21110 La Salle Ave
- 21103 Denker Ave
- 21143 Denker Ave
- 1530 W 211th St
- 21138 La Salle Ave
- 21120 Denker Ave
- 21126 Denker Ave
- 21116 Denker Ave
- 21104 La Salle Ave
- 21130 Denker Ave