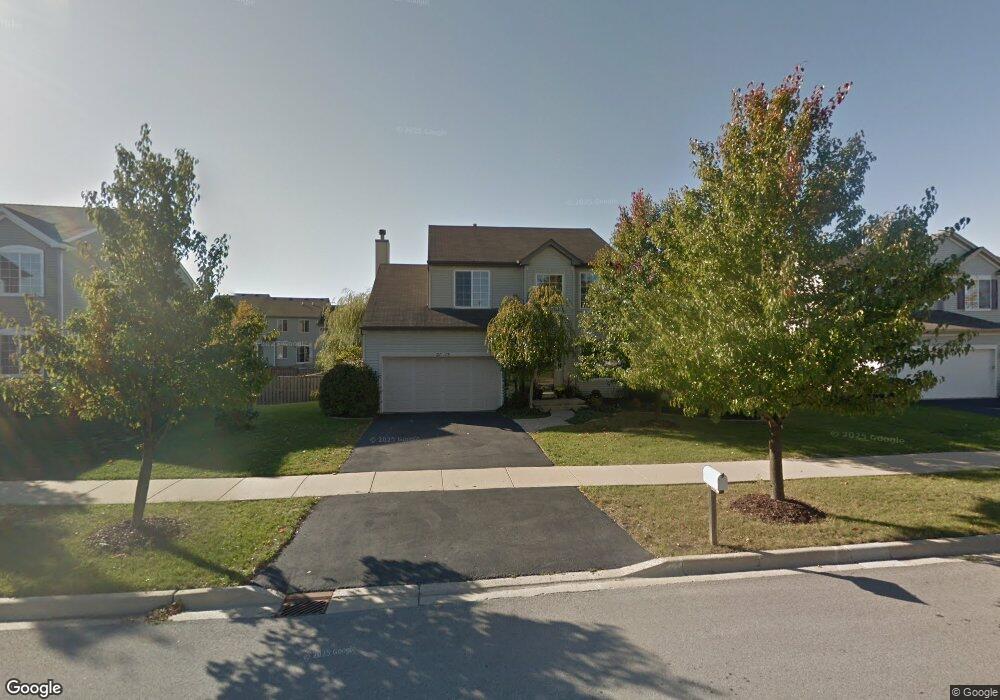
2113 Grand Pointe Trail Aurora, IL 60503
Far Southeast NeighborhoodEstimated Value: $430,000 - $488,000
3
Beds
3
Baths
2,007
Sq Ft
$230/Sq Ft
Est. Value
About This Home
This home is located at 2113 Grand Pointe Trail, Aurora, IL 60503 and is currently estimated at $460,767, approximately $229 per square foot. 2113 Grand Pointe Trail is a home located in Kendall County with nearby schools including The Wheatlands Elementary School, Bednarcik Jr. High School, and Oswego East High School.
Ownership History
Date
Name
Owned For
Owner Type
Purchase Details
Closed on
May 20, 2024
Sold by
Drewek Mark J and Labrasca Dina C
Bought by
Drewek Mark J
Current Estimated Value
Home Financials for this Owner
Home Financials are based on the most recent Mortgage that was taken out on this home.
Original Mortgage
$280,000
Outstanding Balance
$276,833
Interest Rate
7.99%
Mortgage Type
New Conventional
Estimated Equity
$183,934
Purchase Details
Closed on
Apr 7, 2004
Sold by
Grand Pointe Trails Llc
Bought by
Drewek Mark J and Labrasca Dina C
Home Financials for this Owner
Home Financials are based on the most recent Mortgage that was taken out on this home.
Original Mortgage
$202,150
Interest Rate
5.48%
Mortgage Type
Purchase Money Mortgage
Create a Home Valuation Report for This Property
The Home Valuation Report is an in-depth analysis detailing your home's value as well as a comparison with similar homes in the area
Home Values in the Area
Average Home Value in this Area
Purchase History
| Date | Buyer | Sale Price | Title Company |
|---|---|---|---|
| Drewek Mark J | -- | Fidelity National Title | |
| Drewek Mark J | $253,000 | Ticor Title Insurance Compan |
Source: Public Records
Mortgage History
| Date | Status | Borrower | Loan Amount |
|---|---|---|---|
| Open | Drewek Mark J | $280,000 | |
| Previous Owner | Drewek Mark J | $202,150 |
Source: Public Records
Tax History Compared to Growth
Tax History
| Year | Tax Paid | Tax Assessment Tax Assessment Total Assessment is a certain percentage of the fair market value that is determined by local assessors to be the total taxable value of land and additions on the property. | Land | Improvement |
|---|---|---|---|---|
| 2024 | $10,633 | $125,680 | $33,929 | $91,751 |
| 2023 | $9,486 | $110,245 | $29,762 | $80,483 |
| 2022 | $9,486 | $100,222 | $27,056 | $73,166 |
| 2021 | $9,546 | $97,303 | $26,268 | $71,035 |
| 2020 | $9,264 | $93,561 | $25,258 | $68,303 |
| 2019 | $9,129 | $90,309 | $25,258 | $65,051 |
| 2018 | $9,054 | $89,940 | $25,155 | $64,785 |
| 2017 | $8,777 | $82,894 | $23,184 | $59,710 |
| 2016 | $8,201 | $76,754 | $21,467 | $55,287 |
| 2015 | $7,600 | $68,530 | $19,167 | $49,363 |
| 2014 | -- | $64,651 | $18,082 | $46,569 |
| 2013 | -- | $62,768 | $17,555 | $45,213 |
Source: Public Records
Map
Nearby Homes
- 1611 Fredericksburg Ln Unit 1
- 2216 Summerlin Dr Unit 5
- 2060 Lyndhurst Ln
- 2084 Canyon Creek Ct
- 1794 Fredericksburg Ln
- 1870 Canyon Creek Dr
- 1830 Canyon Creek Dr
- 1880 Canyon Creek Dr
- Bellamy Plan at Wheatland Crossing
- Henley Plan at Wheatland Crossing
- Ashton Plan at Wheatland Crossing
- Coventry Plan at Wheatland Crossing
- 1739 Baler Ave
- 1751 Baler Ave
- 1757 Baler Ave
- 1745 Baler Ave
- 2047 James Leigh Dr
- 1906 Indian Hill Ln Unit 4223
- 1961 Wilson Creek Cir
- 1763 Baler Ave
- 2119 Grand Pointe Trail
- 2107 Grand Pointe Trail
- 1614 Fredericksburg Ln Unit 2
- 1612 Fredericksburg Ln Unit 1
- 1616 Fredericksburg Ln
- 1608 Fredericksburg Ln Unit 15
- 1610 Fredericksburg Ln Unit 61
- 1618 Fredericksburg Ln
- 2125 Grand Pointe Trail
- 2101 Grand Pointe Trail
- 1606 Fredericksburg Ln
- 1620 Fredericksburg Ln
- 1622 Fredericksburg Ln Unit 6
- 1620 Fredericksburg Ln Unit 1620
- 1604 Fredericksburg Ln
- 2114 Grand Pointe Trail
- 2108 Grand Pointe Trail
- 2120 Grand Pointe Trail
- 1600 Fredericksburg Ln Unit 1
- 1602 Fredericksburg Ln Unit 2