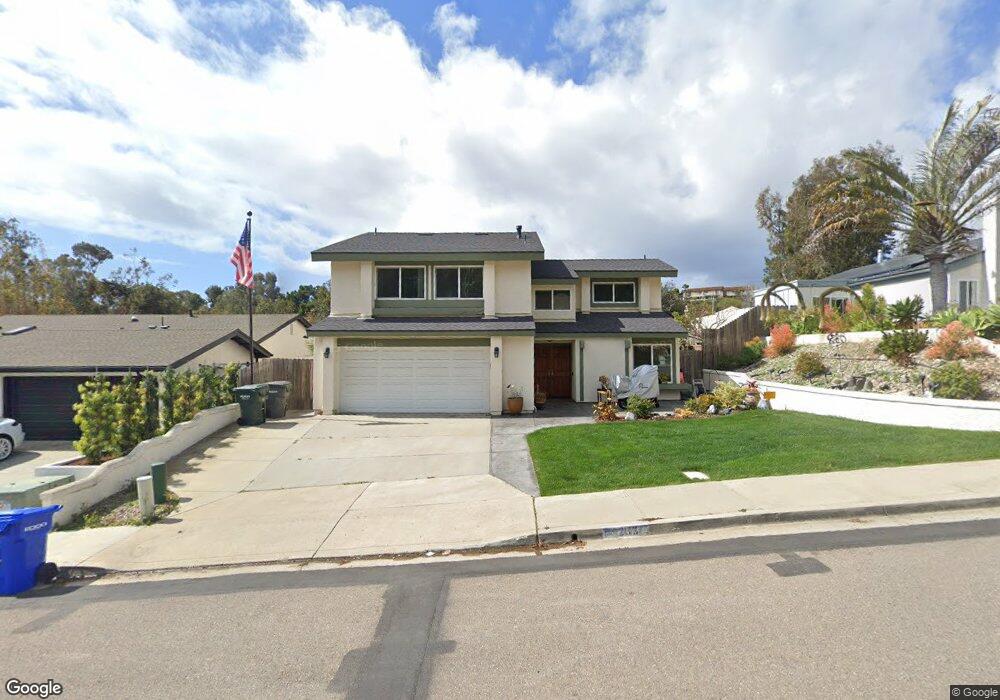
2113 Pleasant Grove Rd Encinitas, CA 92024
Central Encinitas NeighborhoodEstimated Value: $1,409,000 - $2,014,936
5
Beds
3
Baths
2,433
Sq Ft
$747/Sq Ft
Est. Value
About This Home
This home is located at 2113 Pleasant Grove Rd, Encinitas, CA 92024 and is currently estimated at $1,816,984, approximately $746 per square foot. 2113 Pleasant Grove Rd is a home located in San Diego County with nearby schools including Park Dale Lane Elementary, Diegueno Middle School, and La Costa Canyon High School.
Ownership History
Date
Name
Owned For
Owner Type
Purchase Details
Closed on
Aug 12, 2024
Sold by
Cardone Frank and Cardone Sheryl
Bought by
Cardone Family Trust and Cardone
Current Estimated Value
Purchase Details
Closed on
May 30, 1996
Sold by
Thompson Peter A and Thompson Kelly Elizabeth
Bought by
Cardone Frank and Cardone Sheryl
Home Financials for this Owner
Home Financials are based on the most recent Mortgage that was taken out on this home.
Original Mortgage
$204,250
Interest Rate
7.97%
Purchase Details
Closed on
Aug 28, 1992
Purchase Details
Closed on
Jan 23, 1984
Create a Home Valuation Report for This Property
The Home Valuation Report is an in-depth analysis detailing your home's value as well as a comparison with similar homes in the area
Home Values in the Area
Average Home Value in this Area
Purchase History
| Date | Buyer | Sale Price | Title Company |
|---|---|---|---|
| Cardone Family Trust | -- | None Listed On Document | |
| Cardone Frank | $215,000 | Chicago Title Co | |
| -- | $215,000 | -- | |
| -- | $155,000 | -- |
Source: Public Records
Mortgage History
| Date | Status | Borrower | Loan Amount |
|---|---|---|---|
| Previous Owner | Cardone Frank | $204,250 |
Source: Public Records
Tax History
| Year | Tax Paid | Tax Assessment Tax Assessment Total Assessment is a certain percentage of the fair market value that is determined by local assessors to be the total taxable value of land and additions on the property. | Land | Improvement |
|---|---|---|---|---|
| 2025 | $4,296 | $357,141 | $162,134 | $195,007 |
| 2024 | $4,296 | $350,139 | $158,955 | $191,184 |
| 2023 | $4,149 | $343,275 | $155,839 | $187,436 |
| 2022 | $4,033 | $336,545 | $152,784 | $183,761 |
| 2021 | $3,949 | $329,947 | $149,789 | $180,158 |
| 2020 | $3,871 | $326,565 | $148,254 | $178,311 |
| 2019 | $3,797 | $320,163 | $145,348 | $174,815 |
| 2018 | $3,742 | $313,887 | $142,499 | $171,388 |
| 2017 | $3,680 | $307,733 | $139,705 | $168,028 |
| 2016 | $3,573 | $301,700 | $136,966 | $164,734 |
| 2015 | $3,497 | $297,169 | $134,909 | $162,260 |
| 2014 | $3,404 | $291,349 | $132,267 | $159,082 |
Source: Public Records
Map
Nearby Homes
- 1926 Springdale Ln
- 2118 Valleydale Ln
- 1741 Charleston Ln
- 277 Via Del Cerrito
- 121 Avenida Esperanza
- 245 Fairlee Ln
- 1982 Fairlee Dr
- 1822 Stanton Rd Unit 302
- 1644 Forestdale Dr
- 245 Countryhaven Rd Unit 134
- 516 Whisper Wind Dr
- 1824 Eastwood Ln
- 1830 Gatepost Rd
- 1549 Avenida de Las Adelsas
- 324 Countrywood Ln
- 349 Horizon Dr
- 803 Hollyridge Dr
- 2037 Countrywood Way
- 608 Crest Dr
- 1510 Orangeview Dr Unit 1&2
- 2109 Pleasant Grove Rd
- 2117 Pleasant Grove Rd
- 2105 Pleasant Grove Rd
- 2121 Pleasant Grove Rd
- 2110 Pleasant Grove Rd
- 2116 Pleasant Grove Rd
- 2106 Pleasant Grove Rd
- 2125 Pleasant Grove Rd
- 2120 Pleasant Grove Rd
- 1920 Springdale Ln
- 2102 Pleasant Grove Rd
- 1910 Springdale Ln
- 2124 Pleasant Grove Rd
- 1938 Springdale Ln
- 1902 Springdale Ln
- 1932 Springdale Ln
- 2129 Pleasant Grove Rd
- 1906 Springdale Ln
- 1938 SPRIN Lane
- 1944 Springdale Ln
Your Personal Tour Guide
Ask me questions while you tour the home.