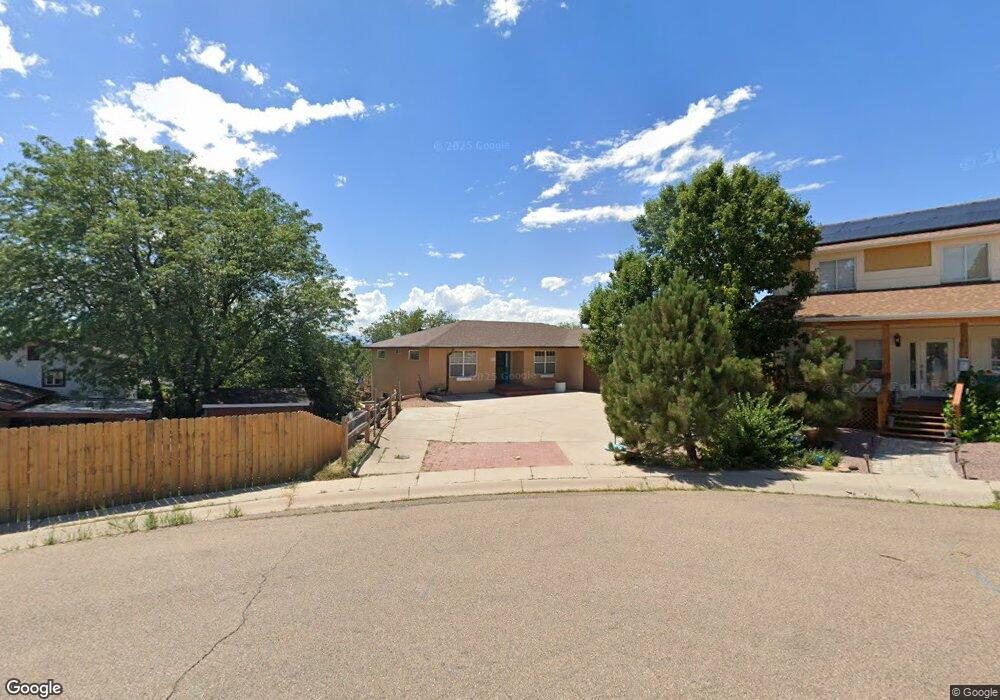
2113 Rangeview Place Pueblo, CO 81008
Ridge NeighborhoodEstimated Value: $359,207 - $454,000
3
Beds
2
Baths
1,803
Sq Ft
$219/Sq Ft
Est. Value
About This Home
This home is located at 2113 Rangeview Place, Pueblo, CO 81008 and is currently estimated at $394,552, approximately $218 per square foot. 2113 Rangeview Place is a home located in Pueblo County with nearby schools including Morton Elementary School, Heaton Middle School, and Centennial High School.
Ownership History
Date
Name
Owned For
Owner Type
Purchase Details
Closed on
Nov 17, 2016
Sold by
Ranes Monica S and Estate Of Lynne G Ranes
Bought by
Metchkov Zahari T
Current Estimated Value
Home Financials for this Owner
Home Financials are based on the most recent Mortgage that was taken out on this home.
Original Mortgage
$180,000
Outstanding Balance
$145,053
Interest Rate
3.54%
Mortgage Type
New Conventional
Estimated Equity
$249,499
Purchase Details
Closed on
May 27, 2004
Sold by
Advance Dev + Mortg Inc
Bought by
Ranes Lynne G + Steve J
Purchase Details
Closed on
Apr 9, 2004
Bought by
Advance Dev + Mortg Inc
Purchase Details
Closed on
Jul 22, 2003
Sold by
Freeman Michael R
Bought by
Freeman Charles
Purchase Details
Closed on
May 18, 2000
Bought by
Freeman Michael R
Create a Home Valuation Report for This Property
The Home Valuation Report is an in-depth analysis detailing your home's value as well as a comparison with similar homes in the area
Home Values in the Area
Average Home Value in this Area
Purchase History
| Date | Buyer | Sale Price | Title Company |
|---|---|---|---|
| Metchkov Zahari T | $225,000 | Stewart Title | |
| Ranes Lynne G + Steve J | $195,000 | -- | |
| Advance Dev + Mortg Inc | -- | -- | |
| Freeman Charles | $209,100 | -- | |
| Freeman Michael R | $25,000 | -- |
Source: Public Records
Mortgage History
| Date | Status | Borrower | Loan Amount |
|---|---|---|---|
| Open | Metchkov Zahari T | $180,000 |
Source: Public Records
Tax History
| Year | Tax Paid | Tax Assessment Tax Assessment Total Assessment is a certain percentage of the fair market value that is determined by local assessors to be the total taxable value of land and additions on the property. | Land | Improvement |
|---|---|---|---|---|
| 2024 | $1,911 | $19,510 | -- | -- |
| 2023 | $1,932 | $23,200 | $1,340 | $21,860 |
| 2022 | $2,166 | $21,823 | $1,390 | $20,433 |
| 2021 | $2,235 | $22,450 | $1,430 | $21,020 |
| 2020 | $1,747 | $17,000 | $1,430 | $15,570 |
| 2019 | $1,748 | $17,309 | $1,216 | $16,093 |
| 2018 | $1,384 | $15,276 | $1,224 | $14,052 |
| 2017 | $1,398 | $15,276 | $1,224 | $14,052 |
| 2016 | $675 | $14,654 | $1,353 | $13,301 |
| 2015 | $1,346 | $14,654 | $1,353 | $13,301 |
| 2014 | $1,346 | $14,845 | $1,353 | $13,492 |
Source: Public Records
Map
Nearby Homes
- 2112 North Dr
- 2212 Cowhand Place
- 2214 Cowhand Place
- 4039 North Dr
- 4212 Getaway Place
- 2216 Longhorn Dr
- 4007 Hillside Dr
- 4038 West Dr
- 4147 Outlook Blvd Unit A
- 2223 Inspiration Ln
- 2309 Meadowlark Ln
- 2319 Longhorn Dr
- 14 Crested Hill Ct
- 2 Cynthia Place
- 29 Frances Place Unit 29
- 1714 Paseo Del Tesoro
- 2315 Newcastle Dr
- 31 Frances Place Unit 31
- 2204 Crestwood Ln
- 4012 Crestview Dr
- 2113 Rangeview Dr
- 2111 Rangeview Place
- 2118 North Place
- 2111 Rangeview Dr
- 2118 North Dr
- 4044 Valley Dr
- 2120 North Dr
- 4046 Valley Dr
- 4042 Valley Dr
- 2109 Rangeview Dr
- 4048 Valley Dr
- 2114 North Dr
- 2120 Rangeview Dr
- 2107 Rangeview Dr
- 2124 Rangeview Dr
- 4050 Valley Dr
- 2122 North Place
- 4038 Valley Dr
- 2110 North Dr
- 2116 Rangeview Dr
Your Personal Tour Guide
Ask me questions while you tour the home.