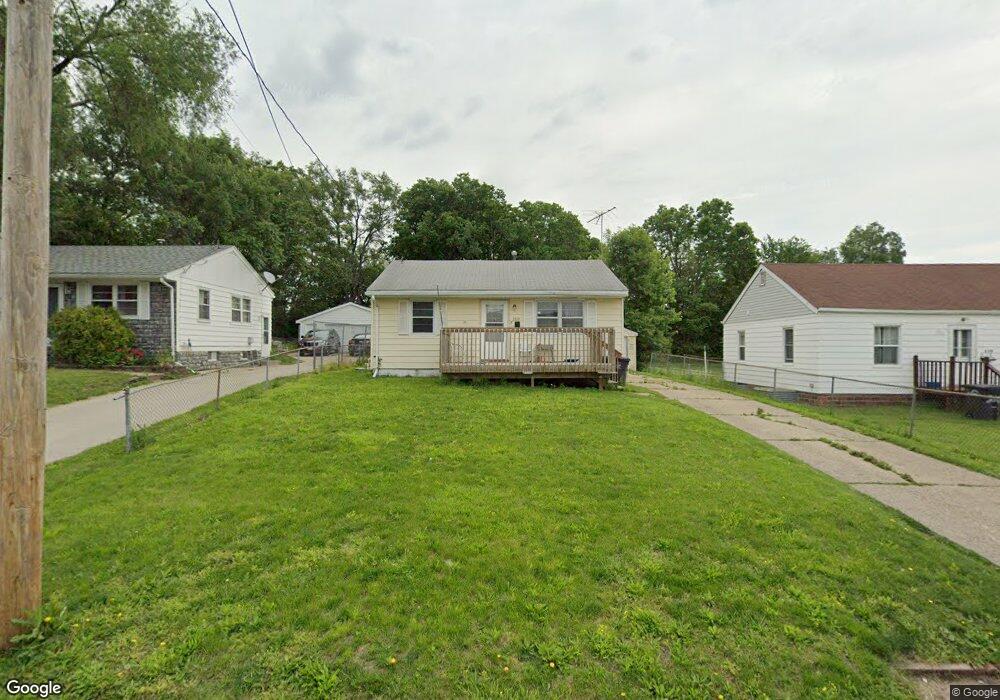
2113 Searle St Des Moines, IA 50317
Fairmont Park NeighborhoodEstimated Value: $146,491 - $161,000
2
Beds
1
Bath
792
Sq Ft
$192/Sq Ft
Est. Value
About This Home
This home is located at 2113 Searle St, Des Moines, IA 50317 and is currently estimated at $151,873, approximately $191 per square foot. 2113 Searle St is a home located in Polk County with nearby schools including Phillips Elementary, Goodrell Middle School, and North High School.
Ownership History
Date
Name
Owned For
Owner Type
Purchase Details
Closed on
Dec 8, 2016
Sold by
Wulfekuhle Gary
Bought by
Wulfekuhle Kelli
Current Estimated Value
Purchase Details
Closed on
May 27, 2008
Sold by
Poore Claire and Poore Claire Eugene
Bought by
Wulfekuhle Gary and Wulfekuhle Kelli
Purchase Details
Closed on
Feb 9, 2008
Sold by
Martin Sandra K
Bought by
Poore Claire
Create a Home Valuation Report for This Property
The Home Valuation Report is an in-depth analysis detailing your home's value as well as a comparison with similar homes in the area
Home Values in the Area
Average Home Value in this Area
Purchase History
| Date | Buyer | Sale Price | Title Company |
|---|---|---|---|
| Wulfekuhle Kelli | -- | None Available | |
| Wulfekuhle Gary | $79,500 | Itc | |
| Poore Claire | $35,500 | None Available |
Source: Public Records
Tax History Compared to Growth
Tax History
| Year | Tax Paid | Tax Assessment Tax Assessment Total Assessment is a certain percentage of the fair market value that is determined by local assessors to be the total taxable value of land and additions on the property. | Land | Improvement |
|---|---|---|---|---|
| 2025 | $2,228 | $129,200 | $26,100 | $103,100 |
| 2024 | $2,228 | $113,300 | $22,600 | $90,700 |
| 2023 | $2,082 | $113,300 | $22,600 | $90,700 |
| 2022 | $2,066 | $88,300 | $17,900 | $70,400 |
| 2021 | $1,956 | $88,300 | $17,900 | $70,400 |
| 2020 | $2,032 | $78,400 | $15,800 | $62,600 |
| 2019 | $1,738 | $78,400 | $15,800 | $62,600 |
| 2018 | $1,722 | $64,700 | $13,100 | $51,600 |
| 2017 | $1,720 | $64,700 | $13,100 | $51,600 |
| 2016 | $1,676 | $63,600 | $12,600 | $51,000 |
| 2015 | $1,676 | $63,600 | $12,600 | $51,000 |
| 2014 | $1,704 | $64,100 | $12,500 | $51,600 |
Source: Public Records
Map
Nearby Homes
- 2112 E 23rd St
- 2124 E 23rd St
- 1915 E 22nd St
- 1901 E 23rd St
- 2208 Tichenor St
- 2216 Lay St
- 2323 E 23rd St
- 2324 E 23rd St
- 2021 E 25th St
- 2503 E 24th St
- 1821 E 25th St
- 1614 Searle St
- 1603 Searle St
- 1601 E 22nd St
- 2809 E 24th St
- 2114 Boyd St
- 2645 Wisconsin Ave
- 1529 E 19th St
- 1410 E 23rd St
- 1415 Delaware Ave