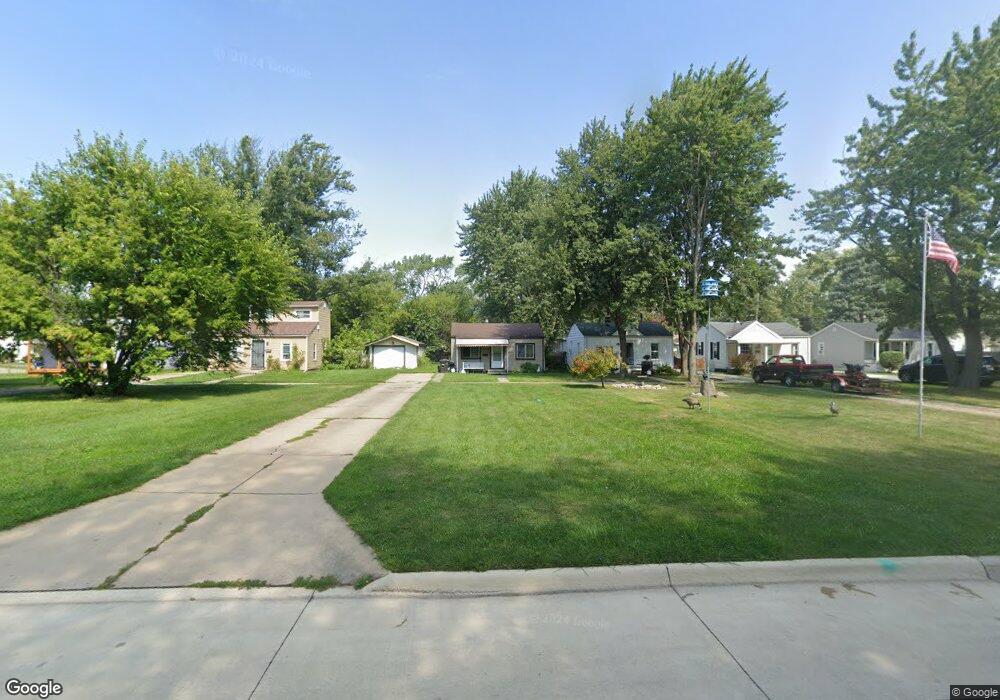
21138 Pinecrest St Taylor, MI 48180
Estimated Value: $124,000 - $140,983
3
Beds
1
Bath
797
Sq Ft
$169/Sq Ft
Est. Value
About This Home
This home is located at 21138 Pinecrest St, Taylor, MI 48180 and is currently estimated at $134,496, approximately $168 per square foot. 21138 Pinecrest St is a home located in Wayne County with nearby schools including Taylor Parks Elementary School and Robert J. West Middle School.
Ownership History
Date
Name
Owned For
Owner Type
Purchase Details
Closed on
Nov 30, 2009
Sold by
Donovan Shaun and Secretary Of Housing & Urban D
Bought by
Clark Joseph
Current Estimated Value
Purchase Details
Closed on
Jun 1, 2009
Sold by
Citimortgage Inc
Bought by
Secretary Of Housing & Urban Development
Purchase Details
Closed on
Oct 29, 2008
Sold by
Mahan Susan and Akers Jeremy
Bought by
Citimortgage Inc
Purchase Details
Closed on
Jun 6, 2007
Sold by
Mahan Leroy and Mahan Wendy
Bought by
Mahan Susan P
Home Financials for this Owner
Home Financials are based on the most recent Mortgage that was taken out on this home.
Original Mortgage
$103,022
Interest Rate
6.26%
Mortgage Type
FHA
Purchase Details
Closed on
Apr 28, 2005
Sold by
Mahan Leroy and Mahan Wendy
Bought by
Mahan Leroy
Purchase Details
Closed on
Dec 23, 2004
Sold by
Dunham James K and Dunham Toni
Bought by
Mahan Leroy
Create a Home Valuation Report for This Property
The Home Valuation Report is an in-depth analysis detailing your home's value as well as a comparison with similar homes in the area
Home Values in the Area
Average Home Value in this Area
Purchase History
| Date | Buyer | Sale Price | Title Company |
|---|---|---|---|
| Clark Joseph | $10,000 | None Available | |
| Secretary Of Housing & Urban Development | -- | None Available | |
| Citimortgage Inc | $107,380 | None Available | |
| Mahan Susan P | -- | None Available | |
| Mahan Leroy | -- | -- | |
| Mahan Leroy | $80,000 | Multiple |
Source: Public Records
Mortgage History
| Date | Status | Borrower | Loan Amount |
|---|---|---|---|
| Previous Owner | Mahan Susan P | $103,022 |
Source: Public Records
Tax History Compared to Growth
Tax History
| Year | Tax Paid | Tax Assessment Tax Assessment Total Assessment is a certain percentage of the fair market value that is determined by local assessors to be the total taxable value of land and additions on the property. | Land | Improvement |
|---|---|---|---|---|
| 2025 | $1,249 | $64,300 | $0 | $0 |
| 2024 | $1,249 | $56,600 | $0 | $0 |
| 2023 | $1,503 | $47,900 | $0 | $0 |
| 2022 | $1,192 | $41,100 | $0 | $0 |
| 2021 | $1,474 | $38,700 | $0 | $0 |
| 2020 | $1,510 | $33,400 | $0 | $0 |
| 2019 | $151,979 | $28,500 | $0 | $0 |
| 2018 | $1,024 | $23,900 | $0 | $0 |
| 2017 | $1,026 | $24,000 | $0 | $0 |
| 2016 | $1,523 | $23,300 | $0 | $0 |
| 2015 | $2,570 | $25,700 | $0 | $0 |
| 2013 | $2,590 | $26,800 | $0 | $0 |
| 2012 | $1,126 | $26,000 | $9,500 | $16,500 |
Source: Public Records
Map
Nearby Homes
- 7267 William St
- 7564 Clippert St
- 6485 Huron St
- 7584 William St
- 22028 Guidot St
- 7847 William St
- 6640 Jackson St
- 7580 Mayfair St
- 7866 Katherine St
- 6056 Clippert St
- 20742 Champaign St
- 7713 Jackson St
- 5873 Merrick St
- 7854 Jackson St
- 8025 Mayfair St
- 19249 Pinecrest Dr
- 5869 Hipp St
- 5939 Mayfair St
- 5977 Weddel St
- 7190 Buckingham Ave
- 21128 Pinecrest St
- 21144 Pinecrest St
- 21118 Pinecrest St
- 21154 Pinecrest St
- 6703 Campbell St
- 21108 Pinecrest St
- 6680 Mortenview Dr
- 6687 Campbell St
- 6679 Campbell St
- 6678 Mortenview Dr
- 21208 Pinecrest St
- 21058 Pinecrest St
- 21220 Pinecrest St
- 6662 Mortenview Dr
- 21046 Pinecrest St
- 6663 Campbell St
- 6710 Campbell St
- 6700 Campbell St
- 6681 Mortenview Dr
- 21228 Pinecrest St