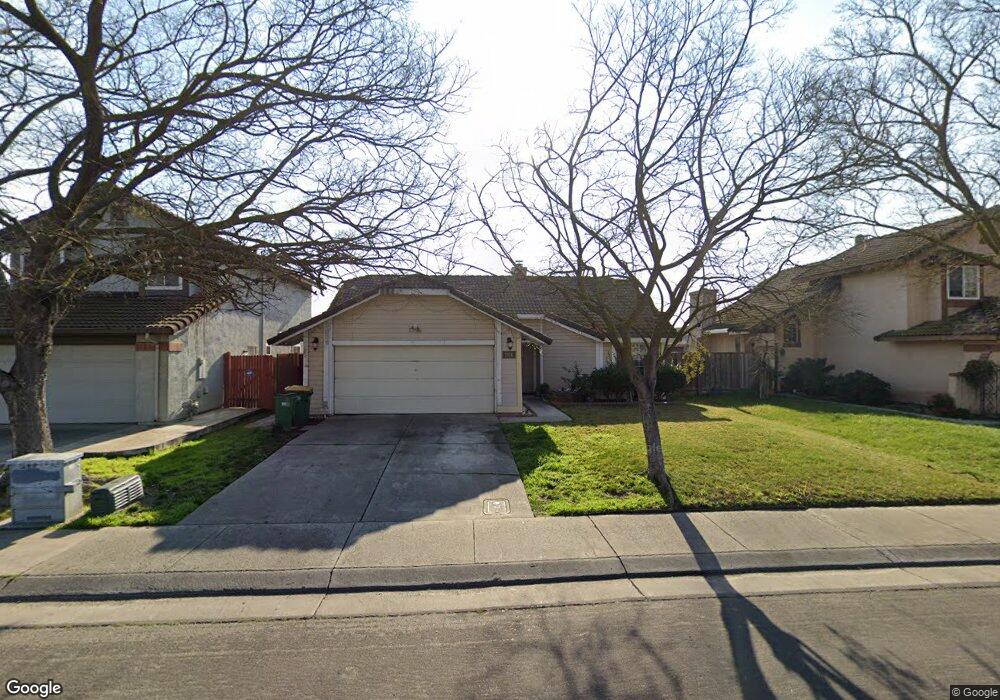
2114 Atchenson St Stockton, CA 95210
Valley Oak NeighborhoodEstimated Value: $267,000 - $402,000
3
Beds
2
Baths
1,094
Sq Ft
$321/Sq Ft
Est. Value
About This Home
This home is located at 2114 Atchenson St, Stockton, CA 95210 and is currently estimated at $351,430, approximately $321 per square foot. 2114 Atchenson St is a home located in San Joaquin County with nearby schools including Rio Calaveras Elementary School, George W. Bush Elementary School, and Valentine Peyton Elementary School.
Ownership History
Date
Name
Owned For
Owner Type
Purchase Details
Closed on
Jan 11, 1995
Sold by
Wooding Sandra Hernandez
Bought by
Wooding Michael Vernon
Current Estimated Value
Purchase Details
Closed on
Feb 21, 1994
Sold by
Duminy Martial A and Duminy Kalliope G
Bought by
Barcinas Francisco Sablan and Barcinas Maritess T
Home Financials for this Owner
Home Financials are based on the most recent Mortgage that was taken out on this home.
Original Mortgage
$103,530
Interest Rate
8.52%
Mortgage Type
Assumption
Purchase Details
Closed on
Dec 23, 1993
Sold by
Va
Bought by
Duminy Martial A and Duminy Kalliope G
Home Financials for this Owner
Home Financials are based on the most recent Mortgage that was taken out on this home.
Original Mortgage
$103,530
Interest Rate
8.52%
Mortgage Type
Assumption
Create a Home Valuation Report for This Property
The Home Valuation Report is an in-depth analysis detailing your home's value as well as a comparison with similar homes in the area
Home Values in the Area
Average Home Value in this Area
Purchase History
| Date | Buyer | Sale Price | Title Company |
|---|---|---|---|
| Wooding Michael Vernon | -- | -- | |
| Barcinas Francisco Sablan | $101,500 | North American Title Co | |
| Duminy Martial A | -- | Chicago Title Company |
Source: Public Records
Mortgage History
| Date | Status | Borrower | Loan Amount |
|---|---|---|---|
| Previous Owner | Barcinas Francisco Sablan | $103,530 |
Source: Public Records
Tax History Compared to Growth
Tax History
| Year | Tax Paid | Tax Assessment Tax Assessment Total Assessment is a certain percentage of the fair market value that is determined by local assessors to be the total taxable value of land and additions on the property. | Land | Improvement |
|---|---|---|---|---|
| 2025 | $2,046 | $172,470 | $67,967 | $104,503 |
| 2024 | $2,012 | $169,089 | $66,635 | $102,454 |
| 2023 | $1,966 | $165,775 | $65,329 | $100,446 |
| 2022 | $1,949 | $162,526 | $64,049 | $98,477 |
| 2021 | $1,871 | $159,341 | $62,794 | $96,547 |
| 2020 | $1,907 | $157,709 | $62,151 | $95,558 |
| 2019 | $1,898 | $154,618 | $60,933 | $93,685 |
| 2018 | $1,861 | $151,588 | $59,739 | $91,849 |
| 2017 | $1,761 | $148,617 | $58,568 | $90,049 |
| 2016 | $1,792 | $145,703 | $57,420 | $88,283 |
| 2014 | $1,606 | $133,000 | $40,000 | $93,000 |
Source: Public Records
Map
Nearby Homes
- 5831 Caribbean Cir
- 5431 Strawberry Way
- 5816 Caribbean Cir
- 5813 Fred Russo Dr
- 5271 Barbados Cir
- 5718 Krissi Ct
- 1864 Caleb Cir
- 7028 Tristan Cir
- 1122 Morning Dew Place
- 1926 Shameran St
- 7238 Sharkon Ln
- 2815 Keyser Dr
- 6706 Tam o Shanter Dr Unit 34
- 6706 Tam o Shanter Dr Unit 45
- 6706 Tam O'Shanter Dr Unit 112
- 6706 Tam o Shanter Dr Unit 61
- 6706 Tam O'Shanter Dr Unit 72
- 6706 Tam o Shanter Dr Unit 126
- 6706 Tam O'Shanter Dr Unit 58
- 6706 Tam o Shanter Dr Unit 66
- 2120 Atchenson St
- 2108 Atchenson St
- 2126 Atchenson St
- 2072 Atchenson St
- 5704 Gentry Ave
- 2132 Atchenson St
- 2066 Atchenson St
- 5703 Atchenson Ct
- 5710 Gentry Ave
- 2204 Atchenson St
- 5491 Governor Cir
- 2060 Atchenson St
- 5493 Governor Cir
- 5703 Gentry Ave
- 5489 Governor Cir
- 5495 Governor Cir
- 5707 Atchenson Ct
- 5487 Governor Cir
- 5709 Gentry Ave
- 2212 Atchenson St