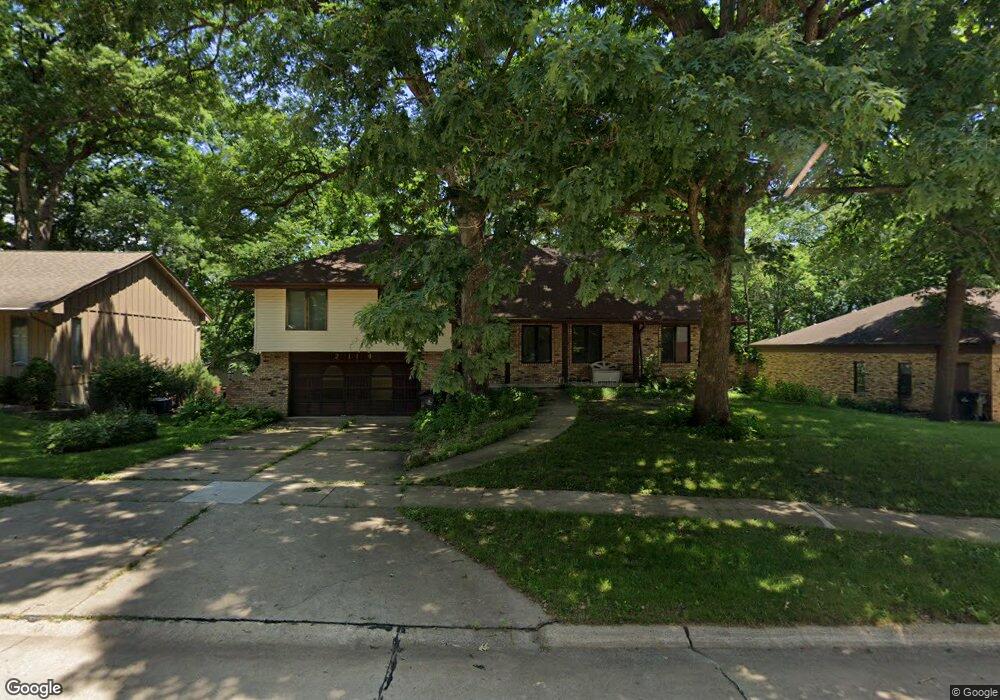
2114 Linmar Dr NE Cedar Rapids, IA 52402
Estimated Value: $282,000 - $323,000
4
Beds
3
Baths
2,760
Sq Ft
$108/Sq Ft
Est. Value
About This Home
This home is located at 2114 Linmar Dr NE, Cedar Rapids, IA 52402 and is currently estimated at $297,265, approximately $107 per square foot. 2114 Linmar Dr NE is a home located in Linn County with nearby schools including Pierce Elementary School, Franklin Middle School, and John F. Kennedy High School.
Ownership History
Date
Name
Owned For
Owner Type
Purchase Details
Closed on
Feb 24, 2023
Sold by
Edmonds Deanna
Bought by
Edmonds Michael
Current Estimated Value
Purchase Details
Closed on
Feb 26, 2009
Sold by
Pickett Benjamin J and Pickett Karen L
Bought by
Edmonds Michael R and Edmonds Deanna L
Home Financials for this Owner
Home Financials are based on the most recent Mortgage that was taken out on this home.
Original Mortgage
$198,150
Interest Rate
5.14%
Mortgage Type
VA
Purchase Details
Closed on
Aug 14, 1998
Sold by
Ghosh Sima and Ghosh Chirantan
Bought by
Pickett Benjamin J and Pickett Karen L
Home Financials for this Owner
Home Financials are based on the most recent Mortgage that was taken out on this home.
Original Mortgage
$132,000
Interest Rate
6.99%
Create a Home Valuation Report for This Property
The Home Valuation Report is an in-depth analysis detailing your home's value as well as a comparison with similar homes in the area
Home Values in the Area
Average Home Value in this Area
Purchase History
| Date | Buyer | Sale Price | Title Company |
|---|---|---|---|
| Edmonds Michael | -- | -- | |
| Edmonds Michael R | $193,500 | None Available | |
| Pickett Benjamin J | $164,500 | -- |
Source: Public Records
Mortgage History
| Date | Status | Borrower | Loan Amount |
|---|---|---|---|
| Previous Owner | Edmonds Michael R | $198,150 | |
| Previous Owner | Pickett Benjamin J | $132,000 |
Source: Public Records
Tax History Compared to Growth
Tax History
| Year | Tax Paid | Tax Assessment Tax Assessment Total Assessment is a certain percentage of the fair market value that is determined by local assessors to be the total taxable value of land and additions on the property. | Land | Improvement |
|---|---|---|---|---|
| 2025 | $4,268 | $242,400 | $55,900 | $186,500 |
| 2024 | $4,496 | $246,600 | $51,800 | $194,800 |
| 2023 | $4,496 | $251,600 | $51,800 | $199,800 |
| 2022 | $4,132 | $222,000 | $47,600 | $174,400 |
| 2021 | $4,480 | $208,400 | $47,600 | $160,800 |
| 2020 | $4,480 | $211,600 | $37,300 | $174,300 |
| 2019 | $4,036 | $195,800 | $37,300 | $158,500 |
| 2018 | $3,922 | $195,800 | $37,300 | $158,500 |
| 2017 | $3,960 | $190,400 | $37,300 | $153,100 |
| 2016 | $4,047 | $190,400 | $37,300 | $153,100 |
| 2015 | $3,935 | $184,952 | $33,120 | $151,832 |
| 2014 | $3,750 | $184,952 | $33,120 | $151,832 |
| 2013 | $3,666 | $184,952 | $33,120 | $151,832 |
Source: Public Records
Map
Nearby Homes
- 2113 Linmar Dr NE
- 2226 Sierra Cir NE
- 2202 Sierra Cir NE
- 2122 Sierra Cir NE
- 2116 Sierra Cir NE
- 2219 Sierra Cir NE
- 2213 Sierra Cir NE
- 2110 Sierra Cir NE
- 2207 Sierra Cir NE
- 2201 Sierra Cir NE
- 2102 Sierra Cir NE
- 2127 Sierra Cir NE
- 2121 Sierra Cir NE
- 2018 Sierra Cir NE
- 2115 Sierra Cir NE
- 2012 Sierra Cir NE
- 2109 Sierra Cir NE
- 2006 Sierra Cir NE
- 2103 Sierra Cir NE
- 2000 Sierra Cir NE
- 2108 Linmar Dr NE
- 2120 Linmar Dr NE
- 1415 Cardinal Ct NE
- 1421 Cardinal Ct NE
- 2102 Linmar Dr NE
- 2119 Linmar Dr NE
- 2125 Linmar Dr NE
- 2026 Linmar Dr NE
- 1427 Cardinal Ct NE
- 1409 Cardinal Ct NE
- 2107 Linmar Dr NE
- 2022 Linmar Dr NE
- 1401 Linmar Dr NE
- 2103 Linmar Dr NE
- 1404 Linmar Dr NE
- 1433 Cardinal Ct NE
- 1323 Sierra Dr NE Unit 17
- 1323 Sierra Dr NE Unit 16
- 1323 Sierra Dr NE Unit 15
- 1323 Sierra Dr NE Unit 14