Estimated Value: $1,053,000 - $1,250,620
2
Beds
2
Baths
1,451
Sq Ft
$797/Sq Ft
Est. Value
About This Home
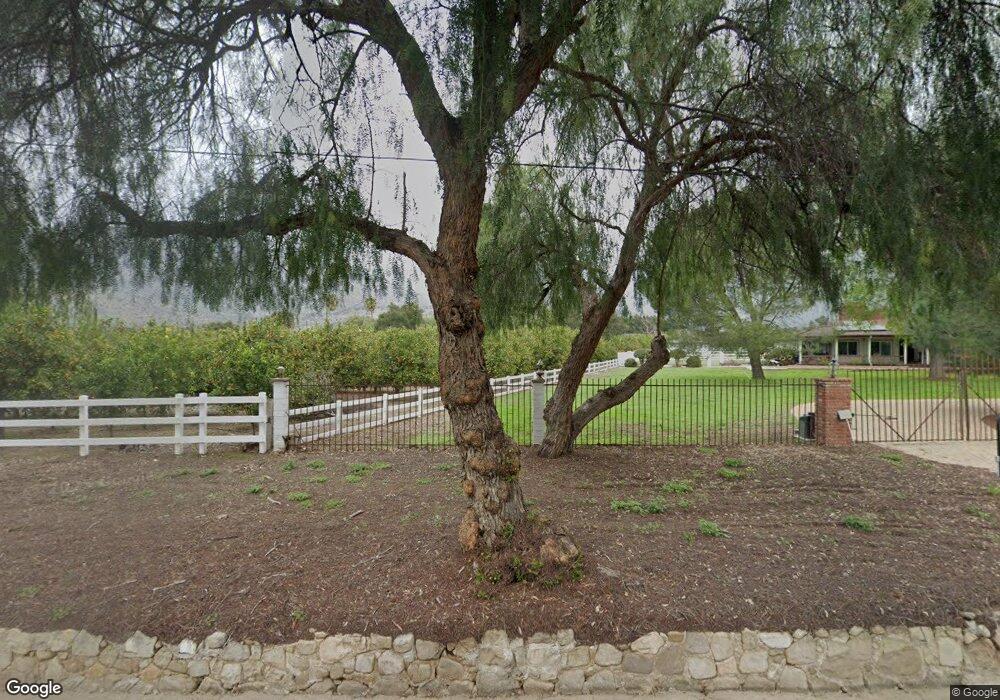
This home is located at 2115 E Ojai Ave, Ojai, CA 93023 and is currently estimated at $1,157,155, approximately $797 per square foot. 2115 E Ojai Ave is a home located in Ventura County with nearby schools including Topa Topa Elementary School, Meiners Oaks Elementary School, and Matilija Junior High.
Ownership History
Date
Name
Owned For
Owner Type
Purchase Details
Closed on
May 25, 2005
Sold by
Cline Mark Terry
Bought by
Cline Connie Burreson
Current Estimated Value
Purchase Details
Closed on
Apr 27, 2000
Sold by
Cline Connie B
Bought by
Cline Mark T
Home Financials for this Owner
Home Financials are based on the most recent Mortgage that was taken out on this home.
Original Mortgage
$385,000
Interest Rate
8.25%
Purchase Details
Closed on
Jul 28, 1997
Sold by
Home Svgs Of America Fsb
Bought by
Cline Mark T
Home Financials for this Owner
Home Financials are based on the most recent Mortgage that was taken out on this home.
Original Mortgage
$226,800
Interest Rate
7.43%
Purchase Details
Closed on
Mar 17, 1997
Sold by
Michael Cooley
Bought by
Home Svgs Of America Fsb
Purchase Details
Closed on
Jan 17, 1997
Sold by
Cooley Michael
Bought by
Sleeper Nolan
Create a Home Valuation Report for This Property
The Home Valuation Report is an in-depth analysis detailing your home's value as well as a comparison with similar homes in the area
Purchase History
| Date | Buyer | Sale Price | Title Company |
|---|---|---|---|
| Cline Connie Burreson | -- | None Available | |
| Cline Mark T | -- | Lawyers Title Company | |
| Cline Mark T | $302,500 | Investors Title Company | |
| Home Svgs Of America Fsb | $309,400 | Stewart Title | |
| Sleeper Nolan | -- | -- |
Source: Public Records
Mortgage History
| Date | Status | Borrower | Loan Amount |
|---|---|---|---|
| Previous Owner | Cline Mark T | $385,000 | |
| Previous Owner | Cline Mark T | $226,800 |
Source: Public Records
Tax History
| Year | Tax Paid | Tax Assessment Tax Assessment Total Assessment is a certain percentage of the fair market value that is determined by local assessors to be the total taxable value of land and additions on the property. | Land | Improvement |
|---|---|---|---|---|
| 2025 | $5,213 | $482,988 | $319,339 | $163,649 |
| 2024 | $5,213 | $473,518 | $313,077 | $160,441 |
| 2023 | $5,033 | $464,234 | $306,938 | $157,296 |
| 2022 | $4,937 | $455,132 | $300,920 | $154,212 |
| 2021 | $4,917 | $446,208 | $295,019 | $151,189 |
| 2020 | $4,794 | $441,635 | $291,995 | $149,640 |
| 2019 | $4,648 | $432,976 | $286,270 | $146,706 |
| 2018 | $4,614 | $424,487 | $280,657 | $143,830 |
| 2017 | $4,516 | $416,164 | $275,154 | $141,010 |
| 2016 | $4,438 | $408,005 | $269,759 | $138,246 |
| 2015 | $4,410 | $401,878 | $265,708 | $136,170 |
| 2014 | $4,193 | $394,007 | $260,504 | $133,503 |
Source: Public Records
Map
Nearby Homes
- 1309 Gregory St
- 507 Gridley Rd
- 985 Fordyce Rd
- 127 Fairway Ln
- 1214 Gregory St
- 1213 San Ramon Way
- 0 E Ojai Ave Unit 224929
- 0 E Ojai Ave Unit V1-33149
- 3359 Reeves Rd
- 1201 Grand Ave
- 915 E Matilija St
- 910 Mercer Ave
- 325 Bryant St
- 1114 Mercer Ave
- 216 N Fulton St
- 203 N Fulton St
- 401 S Fulton St
- 901 Grandview Ave
- 1225 Shippee Ln
- 3741 Grand Ave
- 220 Gorham Rd
- 2153 E Ojai Ave
- 116 Avenida de la Entrada
- 2144 E Ojai Ave
- 2125 E Ojai Ave
- 2156 E Ojai Ave
- 142 Avenida de la Entrada
- 2285 E Ojai Ave
- 2017 E Ojai Ave
- 164 Avenida de la Entrada
- 400 Gorham Rd
- 137 Avenida de la Entrada
- 2222 E Ojai Ave
- 216 Avenida de la Vereda
- 159 Avenida de la Entrada
- 1994 E Ojai Ave
- 222 Avenida de la Vereda
- 1988 E Ojai Ave
- 2264 E Ojai Ave
- 2264 E Ojai Ave Unit 3
Your Personal Tour Guide
Ask me questions while you tour the home.