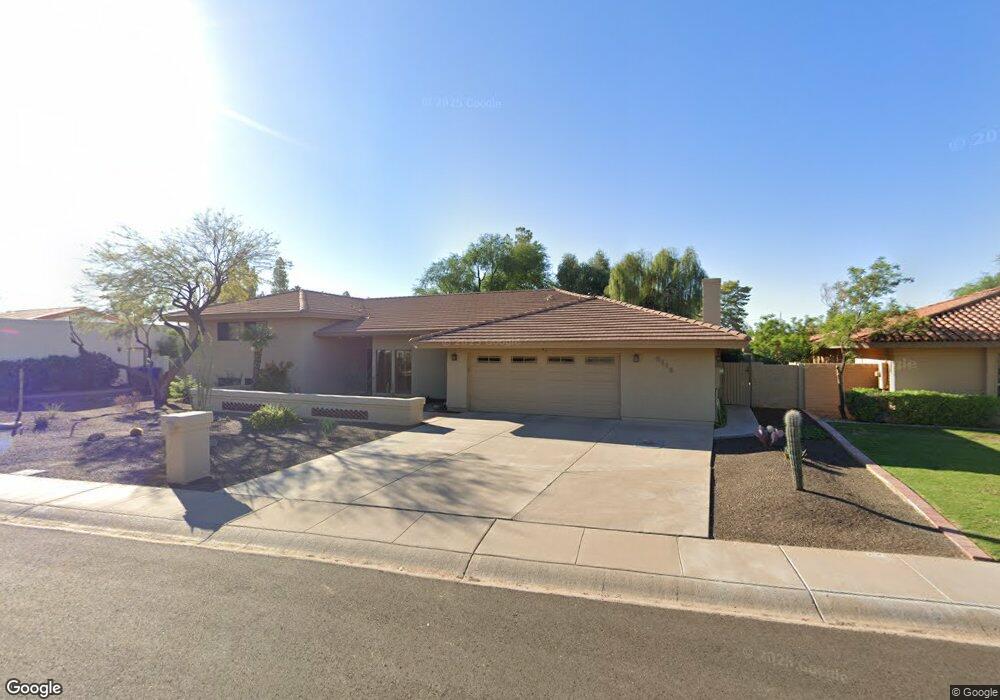
2115 E Woodman Dr Tempe, AZ 85283
South Tempe NeighborhoodEstimated Value: $874,997 - $1,116,000
Studio
4
Baths
3,870
Sq Ft
$262/Sq Ft
Est. Value
About This Home
This home is located at 2115 E Woodman Dr, Tempe, AZ 85283 and is currently estimated at $1,014,499, approximately $262 per square foot. 2115 E Woodman Dr is a home located in Maricopa County with nearby schools including Kyrene del Norte School, Kyrene de los Niños Elementary School, and Kyrene Middle School.
Ownership History
Date
Name
Owned For
Owner Type
Purchase Details
Closed on
Sep 27, 2012
Sold by
Mulligan Mark Robert and Ramsey Toni Marie
Bought by
Mulligan Mark Robert and Ramsey Toni Marie
Current Estimated Value
Purchase Details
Closed on
Oct 19, 2011
Sold by
Mulligan Mark R and Ramsey Toni M
Bought by
Mulligan Mark Robert and Ramsey Toni Marie
Home Financials for this Owner
Home Financials are based on the most recent Mortgage that was taken out on this home.
Original Mortgage
$304,000
Outstanding Balance
$28,579
Interest Rate
4.01%
Mortgage Type
New Conventional
Estimated Equity
$985,920
Purchase Details
Closed on
Mar 15, 2000
Sold by
Leeper Willard Steven and Leeper Martha Alyce
Bought by
Mulligan Mark R and Ramsey Toni M
Home Financials for this Owner
Home Financials are based on the most recent Mortgage that was taken out on this home.
Original Mortgage
$252,700
Interest Rate
8.3%
Mortgage Type
New Conventional
Create a Home Valuation Report for This Property
The Home Valuation Report is an in-depth analysis detailing your home's value as well as a comparison with similar homes in the area
Home Values in the Area
Average Home Value in this Area
Purchase History
| Date | Buyer | Sale Price | Title Company |
|---|---|---|---|
| Mulligan Mark Robert | -- | None Available | |
| Mulligan Mark Robert | -- | Driggs Title Agency Inc | |
| Mulligan Mark R | $329,000 | Ati Title Agency |
Source: Public Records
Mortgage History
| Date | Status | Borrower | Loan Amount |
|---|---|---|---|
| Open | Mulligan Mark Robert | $304,000 | |
| Closed | Mulligan Mark R | $252,700 | |
| Closed | Mulligan Mark R | $25,000 |
Source: Public Records
Tax History
| Year | Tax Paid | Tax Assessment Tax Assessment Total Assessment is a certain percentage of the fair market value that is determined by local assessors to be the total taxable value of land and additions on the property. | Land | Improvement |
|---|---|---|---|---|
| 2025 | $4,869 | $50,157 | -- | -- |
| 2024 | $4,572 | $47,769 | -- | -- |
| 2023 | $4,572 | $64,010 | $12,800 | $51,210 |
| 2022 | $4,332 | $48,830 | $9,760 | $39,070 |
| 2021 | $4,443 | $45,720 | $9,140 | $36,580 |
| 2020 | $4,331 | $43,020 | $8,600 | $34,420 |
| 2019 | $4,185 | $41,530 | $8,300 | $33,230 |
| 2018 | $4,039 | $43,650 | $8,730 | $34,920 |
| 2017 | $3,861 | $40,880 | $8,170 | $32,710 |
| 2016 | $3,901 | $43,420 | $8,680 | $34,740 |
| 2015 | $3,571 | $36,320 | $7,260 | $29,060 |
Source: Public Records
Map
Nearby Homes
- 2101 E Vaughn St
- 6411 S River Dr Unit 6
- 2031 E Vaughn St
- 2021 E Pegasus Dr
- 6320 S Shannon Dr Unit 9
- 1938 E Diamond Dr
- 1947 E Orion St
- 6517 S Hazelton Ln
- 1943 E Diamond Dr
- 2642 W Onza Ave
- 1915 E Gemini Dr Unit 6
- 2713 W Nido Ave
- 2901 W Straford Dr
- 5817 S Siesta Ln
- 2609 S Saratoga
- 2628 W Mendoza Cir
- 2717 W Medina Ave
- 2431 W Portobello Ave
- 6008 S Mcclintock Dr
- 2137 E Cornell Dr
- 2127 E Woodman Dr
- 2103 E Woodman Dr
- 2126 E Vaughn St
- 2114 E Vaughn St
- 2116 E Woodman Dr
- 2104 E Woodman Dr
- 2077 E Woodman Dr
- 2135 E Woodman Dr
- 2102 E Vaughn St
- 2128 E Woodman Dr
- 6439 S Rockford Dr
- 2076 E Vaughn St
- 2134 E Woodman Dr
- 2067 E Woodman Dr
- 6425 S Rockford Dr
- 2115 E Redmon Dr
- 2142 E Woodman Dr
- 2064 E Vaughn St
- 2101 E Redmon Dr
- 2137 E Vaughn St
Your Personal Tour Guide
Ask me questions while you tour the home.