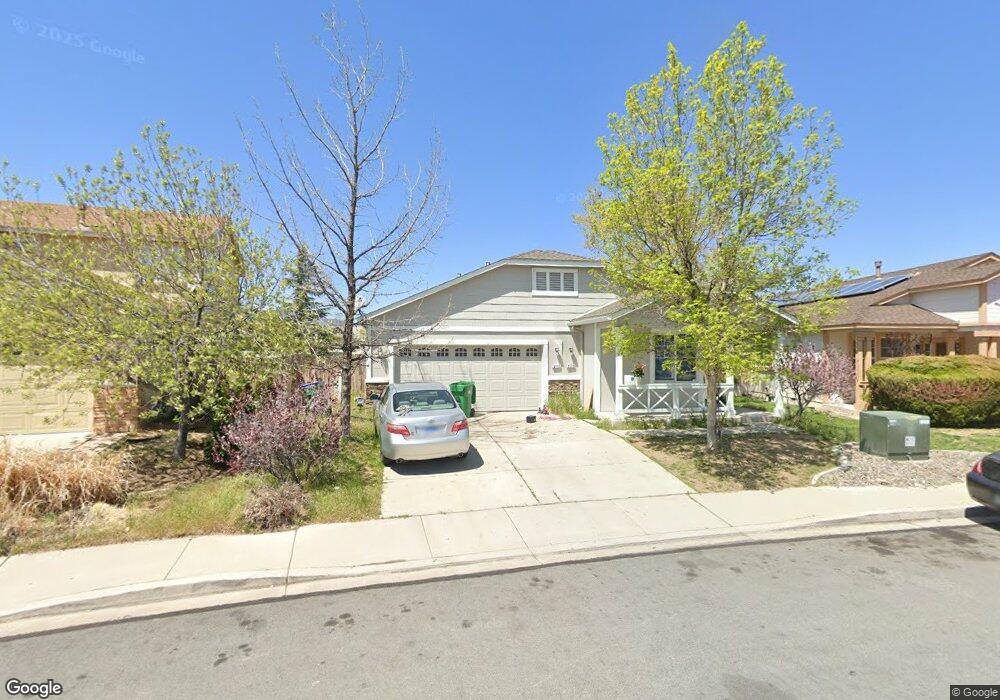
2115 Evergreen Park Dr Unit 13A Reno, NV 89521
Virginia Foothills NeighborhoodEstimated Value: $541,418 - $569,000
3
Beds
2
Baths
1,345
Sq Ft
$413/Sq Ft
Est. Value
About This Home
This home is located at 2115 Evergreen Park Dr Unit 13A, Reno, NV 89521 and is currently estimated at $556,105, approximately $413 per square foot. 2115 Evergreen Park Dr Unit 13A is a home located in Washoe County with nearby schools including Jwood Raw Elementary School, Kendyl Depoali Middle School, and Damonte Ranch High School.
Ownership History
Date
Name
Owned For
Owner Type
Purchase Details
Closed on
Aug 12, 2019
Sold by
Irvin Elizabeth
Bought by
Irvin Rachel Ann
Current Estimated Value
Purchase Details
Closed on
Mar 7, 2016
Sold by
Irvin Rachel
Bought by
Irvin Elizabeth
Purchase Details
Closed on
Sep 29, 2011
Sold by
Hamilton Reid W
Bought by
Irvin Rachel
Purchase Details
Closed on
Jun 23, 2004
Sold by
Bailey and Bailey Dutton
Bought by
Hamilton Reid W
Home Financials for this Owner
Home Financials are based on the most recent Mortgage that was taken out on this home.
Original Mortgage
$164,600
Interest Rate
3.75%
Mortgage Type
Unknown
Create a Home Valuation Report for This Property
The Home Valuation Report is an in-depth analysis detailing your home's value as well as a comparison with similar homes in the area
Home Values in the Area
Average Home Value in this Area
Purchase History
| Date | Buyer | Sale Price | Title Company |
|---|---|---|---|
| Irvin Rachel Ann | -- | None Available | |
| Irvin Elizabeth | $300,000 | None Available | |
| Irvin Rachel | $140,000 | First Centennial Reno | |
| Hamilton Reid W | -- | First Centennial Reno | |
| Hamilton Reid W | $219,500 | Stewart Title Of Northern Nv |
Source: Public Records
Mortgage History
| Date | Status | Borrower | Loan Amount |
|---|---|---|---|
| Previous Owner | Hamilton Reid W | $164,600 |
Source: Public Records
Tax History Compared to Growth
Tax History
| Year | Tax Paid | Tax Assessment Tax Assessment Total Assessment is a certain percentage of the fair market value that is determined by local assessors to be the total taxable value of land and additions on the property. | Land | Improvement |
|---|---|---|---|---|
| 2025 | $2,673 | $97,010 | $35,816 | $61,194 |
| 2024 | $2,673 | $90,706 | $29,075 | $61,632 |
| 2023 | $2,723 | $90,322 | $32,099 | $58,224 |
| 2022 | $2,523 | $76,432 | $27,909 | $48,523 |
| 2021 | $2,449 | $70,887 | $22,617 | $48,270 |
| 2020 | $2,303 | $70,079 | $21,767 | $48,312 |
| 2019 | $2,194 | $67,306 | $20,570 | $46,736 |
| 2018 | $2,094 | $61,094 | $15,372 | $45,722 |
| 2017 | $2,008 | $60,430 | $14,648 | $45,782 |
| 2016 | $1,958 | $59,469 | $12,821 | $46,648 |
| 2015 | $980 | $57,168 | $10,553 | $46,615 |
| 2014 | $1,894 | $55,721 | $10,269 | $45,452 |
| 2013 | -- | $50,083 | $7,980 | $42,103 |
Source: Public Records
Map
Nearby Homes
- 2155 Eagle Greens Dr
- 2250 Trakehner Ln
- 2220 Arpagos Ln
- 2415 Lincoln Meadows Dr
- 2021 Wind Ranch Rd Unit C
- 1932 Wind Ranch Rd Unit C
- 1920 Wind Ranch Rd Unit C
- 1864 Wind Ranch Rd Unit C
- 1875 Sea Horse Rd Unit C
- 2300 Brego Ln
- 1828 Wind Ranch Rd Unit C
- 10630 Birch Point Ct
- 1845 Fledge Creek Dr
- 10118 Mesa Cortona Dr
- 10735 Copper Lake Dr Unit 15A
- 10595 Baton Ct
- 9821 Ash Meadow Dr
- 10135 Burghley Ct
- 10320 Rosemount Dr
- 10375 Rosemount Dr
- 2125 Evergreen Park Dr
- 2135 Evergreen Park Dr
- 2145 Evergreen Park Dr
- 2105 Evergreen Park Dr
- 2120 Evergreen Park Dr
- 2130 Evergreen Park Dr
- 2155 Evergreen Park Dr
- 2140 Evergreen Park Dr
- 2095 Baxter Village Dr
- 2165 Evergreen Park Dr
- 2150 Evergreen Park Dr
- 10030 Stonefield Dr
- 2075 Baxter Village Dr Unit 13A
- 2160 Evergreen Park Dr
- 10010 Eagle Greens Ct
- 2175 Evergreen Park Dr
- 10030 Gold Cup Ln
- 10040 Gold Cup Ln
- 2090 Baxter Village Dr
- 10040 Stonefield Dr