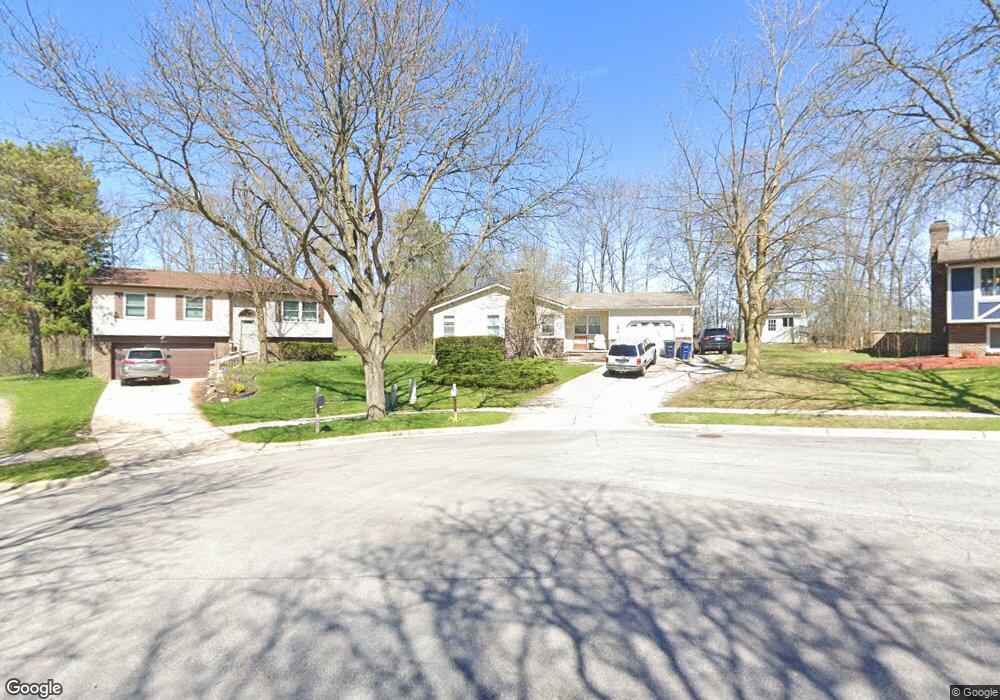
2115 Foss St Ann Arbor, MI 48103
Garden Homes NeighborhoodEstimated Value: $348,000 - $440,000
3
Beds
1
Bath
977
Sq Ft
$399/Sq Ft
Est. Value
About This Home
This home is located at 2115 Foss St, Ann Arbor, MI 48103 and is currently estimated at $389,673, approximately $398 per square foot. 2115 Foss St is a home located in Washtenaw County with nearby schools including Wines Elementary School, Forsythe Middle School, and Skyline High School.
Ownership History
Date
Name
Owned For
Owner Type
Purchase Details
Closed on
Oct 27, 2011
Sold by
Kohendorfer Karla K
Bought by
Roberts Daniel N
Current Estimated Value
Home Financials for this Owner
Home Financials are based on the most recent Mortgage that was taken out on this home.
Original Mortgage
$117,000
Outstanding Balance
$79,590
Interest Rate
3.97%
Mortgage Type
New Conventional
Estimated Equity
$310,083
Purchase Details
Closed on
Oct 25, 2010
Sold by
Kochendorfer Karla
Bought by
Roberts Daniel
Purchase Details
Closed on
Sep 29, 2010
Sold by
Deutsche Bank National Trust Company
Bought by
Roberts Daniel N
Purchase Details
Closed on
Jul 9, 2009
Sold by
Sieczka Jeffrey P and Sieczka Janet K
Bought by
Deutsche Bank National Trust Company
Purchase Details
Closed on
Dec 8, 2005
Sold by
North Maple Corporation
Bought by
Maple Cove Llc
Create a Home Valuation Report for This Property
The Home Valuation Report is an in-depth analysis detailing your home's value as well as a comparison with similar homes in the area
Home Values in the Area
Average Home Value in this Area
Purchase History
| Date | Buyer | Sale Price | Title Company |
|---|---|---|---|
| Roberts Daniel N | -- | Title Direct | |
| Roberts Daniel | -- | None Available | |
| Roberts Daniel N | $68,000 | Parks Title | |
| Deutsche Bank National Trust Company | $77,350 | None Available | |
| Maple Cove Llc | $315,089 | Liberty Title |
Source: Public Records
Mortgage History
| Date | Status | Borrower | Loan Amount |
|---|---|---|---|
| Open | Roberts Daniel N | $117,000 |
Source: Public Records
Tax History Compared to Growth
Tax History
| Year | Tax Paid | Tax Assessment Tax Assessment Total Assessment is a certain percentage of the fair market value that is determined by local assessors to be the total taxable value of land and additions on the property. | Land | Improvement |
|---|---|---|---|---|
| 2025 | $4,136 | $165,800 | $0 | $0 |
| 2024 | $4,034 | $146,100 | $0 | $0 |
| 2023 | $3,719 | $134,100 | $0 | $0 |
| 2022 | $4,053 | $138,200 | $0 | $0 |
| 2021 | $3,957 | $131,800 | $0 | $0 |
| 2020 | $3,877 | $121,200 | $0 | $0 |
| 2019 | $3,690 | $106,600 | $106,600 | $0 |
| 2018 | $3,638 | $100,200 | $0 | $0 |
| 2017 | $3,539 | $103,100 | $0 | $0 |
| 2016 | $3,015 | $70,772 | $0 | $0 |
| 2015 | $3,252 | $70,561 | $0 | $0 |
| 2014 | $3,252 | $68,357 | $0 | $0 |
| 2013 | -- | $68,357 | $0 | $0 |
Source: Public Records
Map
Nearby Homes
- 1431 Hatcher Crescent
- 2374 Newport Rd
- 1115 Western Dr
- 2108 Newport Rd Unit Parcel 2108
- 2108 Newport Rd
- 2136 Newport Rd
- 1006 Duncan St
- 2174 Overlook Ct Unit 326
- 2134 Overlook Ct
- 1797 Miller Ave
- 1276 Kuehnle Ct
- 915 Westwood Ave
- 2086 Autumn Hill Dr Unit 82
- 827 Westwood Ave
- 2844 Whippoorwill Ln
- 520 Center Dr
- 701 Pomona Rd
- 436 Pinewood St
- 609 Ironwood Dr
- 2219 Dexter Ave