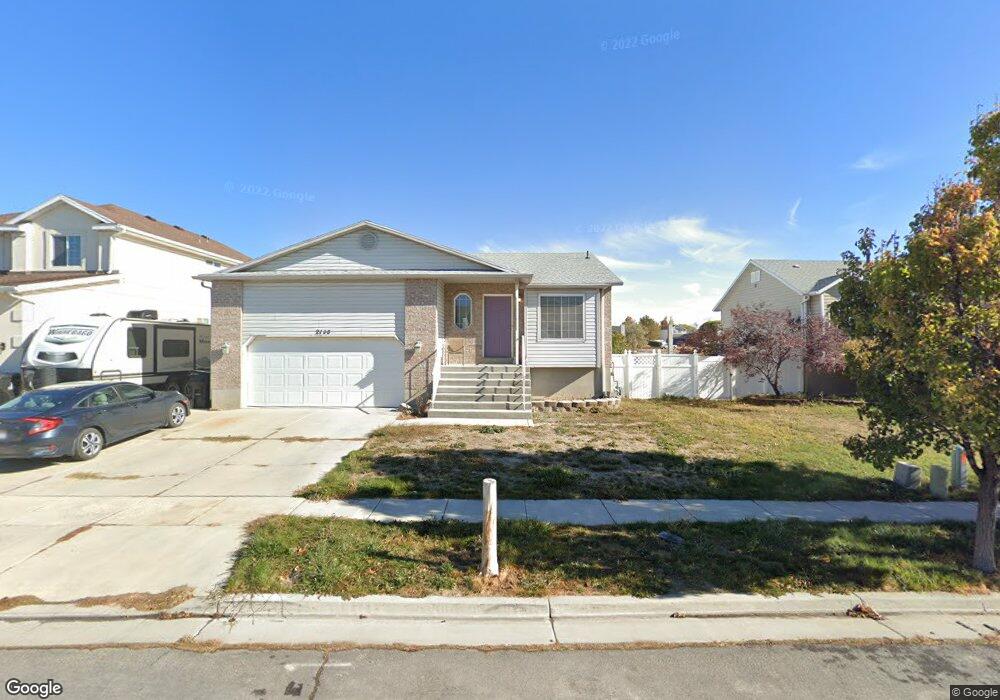
2115 Fremont Crest Ave Syracuse, UT 84075
Estimated Value: $457,000 - $516,688
5
Beds
3
Baths
2,741
Sq Ft
$180/Sq Ft
Est. Value
About This Home
This home is located at 2115 Fremont Crest Ave, Syracuse, UT 84075 and is currently estimated at $494,422, approximately $180 per square foot. 2115 Fremont Crest Ave is a home located in Davis County with nearby schools including Buffalo Point School, Syracuse Junior High School, and Syracuse High School.
Ownership History
Date
Name
Owned For
Owner Type
Purchase Details
Closed on
Jul 3, 2013
Sold by
Nealis Brandi L
Bought by
Geertgens Barbara and Gossett Gretchen
Current Estimated Value
Home Financials for this Owner
Home Financials are based on the most recent Mortgage that was taken out on this home.
Original Mortgage
$10,550
Outstanding Balance
$7,634
Interest Rate
3.88%
Mortgage Type
Unknown
Estimated Equity
$486,788
Purchase Details
Closed on
Oct 4, 2011
Sold by
Hughes Vivian V and Hughes Elizabeth L
Bought by
Nealis Brandi L
Home Financials for this Owner
Home Financials are based on the most recent Mortgage that was taken out on this home.
Original Mortgage
$204,300
Interest Rate
4.16%
Mortgage Type
VA
Purchase Details
Closed on
Feb 5, 2002
Sold by
Woodside Homes Corp
Bought by
Hughes and Hughes Elizabeth L
Home Financials for this Owner
Home Financials are based on the most recent Mortgage that was taken out on this home.
Original Mortgage
$139,022
Interest Rate
7.15%
Mortgage Type
VA
Create a Home Valuation Report for This Property
The Home Valuation Report is an in-depth analysis detailing your home's value as well as a comparison with similar homes in the area
Home Values in the Area
Average Home Value in this Area
Purchase History
| Date | Buyer | Sale Price | Title Company |
|---|---|---|---|
| Geertgens Barbara | -- | None Available | |
| Nealis Brandi L | -- | Mountain View Title | |
| Hughes | -- | First American Title Co |
Source: Public Records
Mortgage History
| Date | Status | Borrower | Loan Amount |
|---|---|---|---|
| Open | Geertgens Barbara | $10,550 | |
| Open | Geertgens Barbara | $211,105 | |
| Previous Owner | Nealis Brandi L | $204,300 | |
| Previous Owner | Hughes | $139,022 |
Source: Public Records
Tax History Compared to Growth
Tax History
| Year | Tax Paid | Tax Assessment Tax Assessment Total Assessment is a certain percentage of the fair market value that is determined by local assessors to be the total taxable value of land and additions on the property. | Land | Improvement |
|---|---|---|---|---|
| 2025 | $2,719 | $262,350 | $98,298 | $164,052 |
| 2024 | $2,724 | $264,550 | $71,244 | $193,306 |
| 2023 | $2,548 | $451,000 | $116,612 | $334,388 |
| 2022 | $2,789 | $270,600 | $54,269 | $216,331 |
| 2021 | $2,417 | $363,000 | $79,619 | $283,381 |
| 2020 | $2,152 | $313,000 | $59,933 | $253,067 |
| 2019 | $2,076 | $298,000 | $65,904 | $232,096 |
| 2018 | $1,923 | $274,000 | $65,546 | $208,454 |
| 2016 | $1,597 | $119,350 | $29,589 | $89,761 |
| 2015 | $1,631 | $116,050 | $29,589 | $86,461 |
| 2014 | $1,494 | $108,338 | $29,589 | $78,749 |
| 2013 | -- | $108,902 | $25,204 | $83,698 |
Source: Public Records
Map
Nearby Homes
- 2297 W 2175 S
- 2961 S 2425 W Unit 1123
- 2696 2495 S Unit 207
- 2524 S 3590 W Unit 602
- 2965 S 3000 W
- 2971 S 2425 W Unit 1124
- 2686 S 2440 W Unit 101
- 2635 S 2430 W Unit 114
- 3062 W Solace St
- 2237 Craig Ln
- 4344 W 1825 S Unit 102
- 4354 W 1825 S Unit 104
- 4348 W 1825 S Unit 103
- 2679 W Antelope Dr
- 2574 S 2430 W Unit 503
- 2982 S 3000 W
- 2912 S 3000 W
- 2136 W 2200 S
- 2455 S Bluff Rd
- 2104 W 2200 S
- 2107 S Fremont
- 2123 Fremont Crest Ave
- 2107 Fremont Crest Ave
- 2123 S Fremont Ave W
- 2123 Fremont Crest Ave
- 2097 S Fremont
- 2097 Fremont Crest Ave
- 2133 Fremont Crest Ave
- 2126 Fremont Crest Ave
- 2118 Fremont Crest Ave
- 2087 S Fremont W
- 2108 Fremont Crest Ave
- 2108 S Fremont
- 2087 Fremont Crest Ave
- 2136 Fremont Crest Ave
- 2143 Fremont Crest Ave
- 2136 S Fremont Crest Ave W
- 2098 Fremont Crest Ave
- 2146 Fremont Crest Ave
- 2098 Fremont Crest Ave