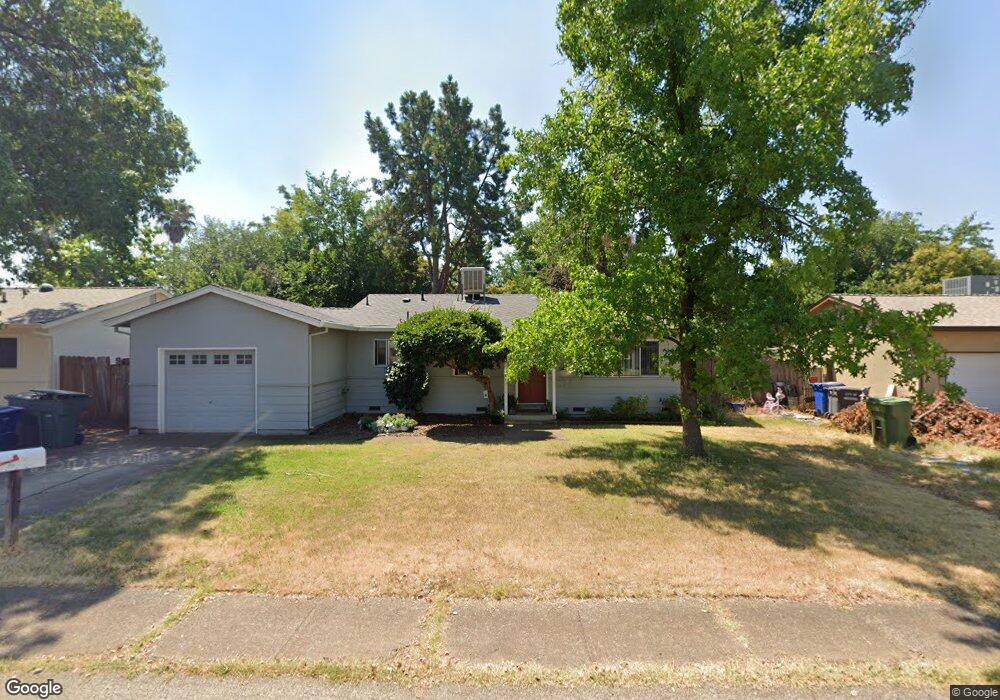
2115 Jupiter Terrace Redding, CA 96002
Starview NeighborhoodEstimated Value: $242,575 - $294,000
3
Beds
1
Bath
920
Sq Ft
$282/Sq Ft
Est. Value
About This Home
This home is located at 2115 Jupiter Terrace, Redding, CA 96002 and is currently estimated at $259,144, approximately $281 per square foot. 2115 Jupiter Terrace is a home located in Shasta County with nearby schools including Alta Mesa Elementary School, Parsons Junior High School, and Enterprise High School.
Ownership History
Date
Name
Owned For
Owner Type
Purchase Details
Closed on
Apr 3, 2013
Sold by
Huntze David G and Huntze Karen A
Bought by
Huntze David Gordon and Huntze Karen Ann
Current Estimated Value
Purchase Details
Closed on
Mar 18, 2003
Sold by
Huntze Dave G and Huntze Karen A
Bought by
Huntze David G and Huntze Karen A
Home Financials for this Owner
Home Financials are based on the most recent Mortgage that was taken out on this home.
Original Mortgage
$77,000
Interest Rate
5.79%
Mortgage Type
Purchase Money Mortgage
Purchase Details
Closed on
Jun 28, 2001
Sold by
Vandoren Robert D and Vandoren Melinda M
Bought by
Huntze Dave G and Huntze Karen A
Home Financials for this Owner
Home Financials are based on the most recent Mortgage that was taken out on this home.
Original Mortgage
$73,800
Interest Rate
7.21%
Mortgage Type
Purchase Money Mortgage
Create a Home Valuation Report for This Property
The Home Valuation Report is an in-depth analysis detailing your home's value as well as a comparison with similar homes in the area
Home Values in the Area
Average Home Value in this Area
Purchase History
| Date | Buyer | Sale Price | Title Company |
|---|---|---|---|
| Huntze David Gordon | -- | None Available | |
| Huntze David G | -- | Fidelity Natl Title Co Of Ca | |
| Huntze Dave G | $82,000 | Placer Title Company |
Source: Public Records
Mortgage History
| Date | Status | Borrower | Loan Amount |
|---|---|---|---|
| Closed | Huntze David G | $77,000 | |
| Closed | Huntze Dave G | $73,800 |
Source: Public Records
Tax History
| Year | Tax Paid | Tax Assessment Tax Assessment Total Assessment is a certain percentage of the fair market value that is determined by local assessors to be the total taxable value of land and additions on the property. | Land | Improvement |
|---|---|---|---|---|
| 2025 | $1,340 | $121,114 | $36,921 | $84,193 |
| 2024 | $1,321 | $118,741 | $36,198 | $82,543 |
| 2023 | $1,321 | $116,414 | $35,489 | $80,925 |
| 2022 | $1,284 | $114,133 | $34,794 | $79,339 |
| 2021 | $1,240 | $111,896 | $34,112 | $77,784 |
| 2020 | $1,234 | $110,750 | $33,763 | $76,987 |
| 2019 | $1,224 | $108,579 | $33,101 | $75,478 |
| 2018 | $1,210 | $106,451 | $32,452 | $73,999 |
| 2017 | $1,231 | $104,365 | $31,816 | $72,549 |
| 2016 | $1,152 | $102,320 | $31,193 | $71,127 |
| 2015 | $1,143 | $100,784 | $30,725 | $70,059 |
| 2014 | $1,134 | $98,811 | $30,124 | $68,687 |
Source: Public Records
Map
Nearby Homes
- 2068 Solar Way
- 3732 Mercury Dr
- 2332 Venus Way
- 3528 Silverwood St
- 3425 Silverwood St
- 3341 Timbercreek Dr
- 3594 Laramie St
- 3466 Silverwood St
- 1827 Bembow Dr
- 3778 Scorpius Way
- 3688 Polaris Way
- 3985 Cirrus St
- 4001 Alta Mesa Dr
- 3512 Capricorn Way
- 3072 Alta Mesa Dr
- 0 Shasta View Unit 25-1945
- 3293 Middleton Ln
- 3283 Middleton Ln
- 2976 West Way
- 1513 Harpole Rd
- 2127 Jupiter Terrace
- 2103 Jupiter Terrace
- 2120 Solar Way
- 2108 Solar Way
- 2091 Jupiter Terrace
- 2139 Jupiter Terrace
- 2094 Solar Way
- 2134 Solar Way
- 2116 Jupiter Terrace
- 2128 Jupiter Terrace
- 2104 Jupiter Terrace
- 2077 Jupiter Terrace
- 2146 Solar Way
- 2151 Jupiter Terrace
- 2082 Solar Way
- 2092 Jupiter Terrace
- 2140 Jupiter Terrace
- 2078 Jupiter Terrace
- 2152 Jupiter Terrace
- 2065 Jupiter Terrace
Your Personal Tour Guide
Ask me questions while you tour the home.