
Seller's Agent in 2025
Pamela Keczmer
Howard Hanna
(724) 601-5442
9 in this area
108 Total Sales
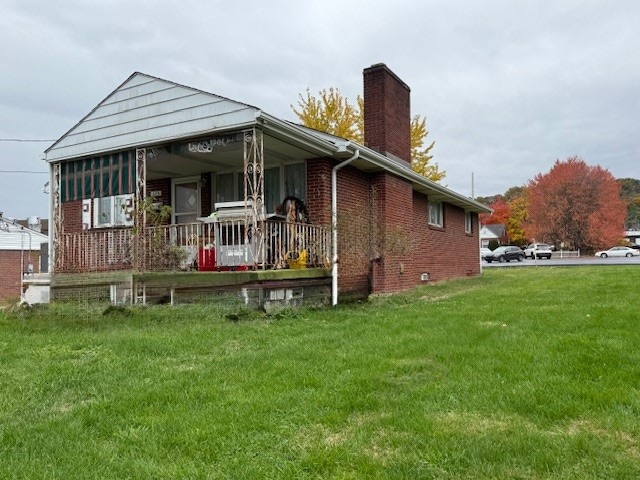
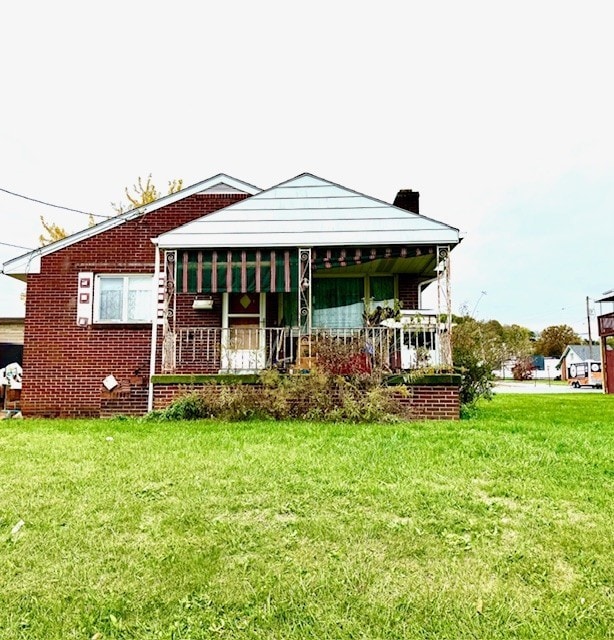
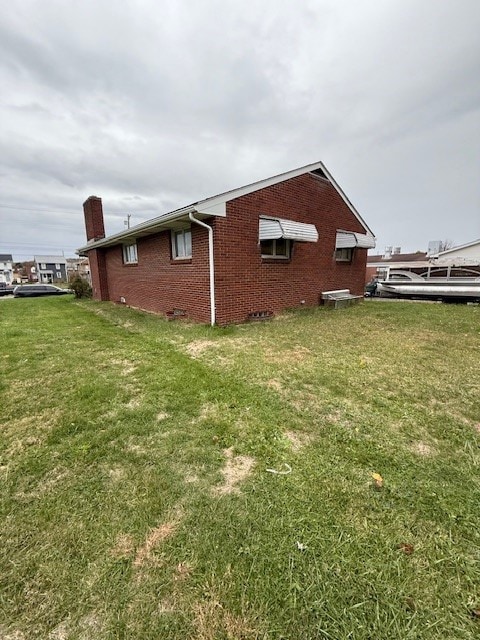
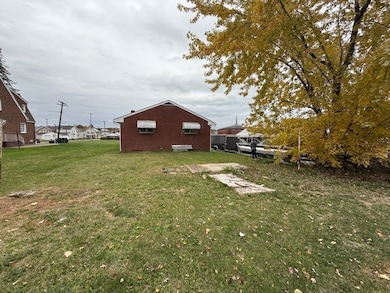
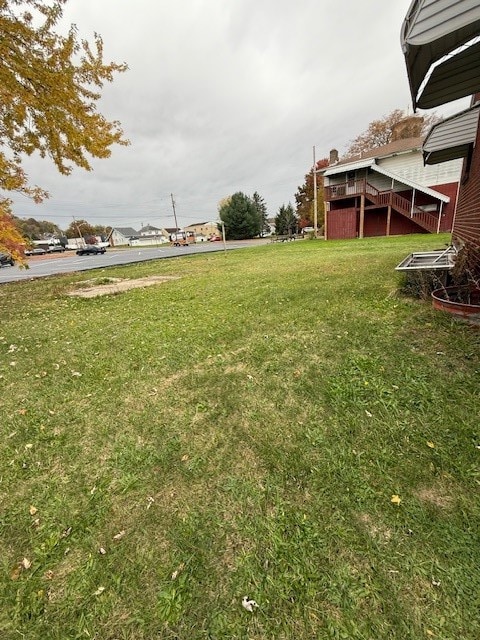
Calling all investors and flippers! This solid 3-bedroom, 2-bath brick ranch is packed with potential. Features include an eat-in kitchen, spacious dining & living rooms, and a huge lower level with a beautiful brick fireplace—just waiting to be transformed into extra living space or an entertainment area.Enjoy a level backyard and prime location—walking distance to shops and restaurants, and only 15 minutes from the Pittsburgh Airport!
All items will be removed prior to closing, making this a clean slate for your next project. Bring your vision and make this home shine again!
Last Agent to Sell the Property
HOWARD HANNA REAL ESTATE SERVICES Listed on: 10/30/2025
| Date | Type | Sale Price | Title Company |
|---|---|---|---|
| Special Warranty Deed | $75,000 | Barristers Land Abstract | |
| Deed | $47,500 | Wynn Craig E | |
| Warranty Deed | $72,000 | -- |
| Date | Status | Loan Amount | Loan Type |
|---|---|---|---|
| Previous Owner | $57,600 | New Conventional |
| Date | Event | Price | List to Sale | Price per Sq Ft |
|---|---|---|---|---|
| 12/19/2025 12/19/25 | Sold | $75,000 | -24.2% | $60 / Sq Ft |
| 10/30/2025 10/30/25 | For Sale | $99,000 | -- | $80 / Sq Ft |
| Year | Tax Paid | Tax Assessment Tax Assessment Total Assessment is a certain percentage of the fair market value that is determined by local assessors to be the total taxable value of land and additions on the property. | Land | Improvement |
|---|---|---|---|---|
| 2025 | $452 | $61,550 | $7,200 | $54,350 |
| 2024 | $2,424 | $61,550 | $7,200 | $54,350 |
| 2023 | $2,575 | $19,350 | $3,200 | $16,150 |
| 2022 | $2,520 | $19,350 | $3,200 | $16,150 |
| 2021 | $2,520 | $19,350 | $3,200 | $16,150 |
| 2020 | $2,459 | $19,350 | $3,200 | $16,150 |
| 2019 | $503 | $19,350 | $3,200 | $16,150 |
| 2018 | $2,365 | $19,350 | $3,200 | $16,150 |
| 2017 | $1,666 | $19,350 | $3,200 | $16,150 |
| 2016 | $2,209 | $19,350 | $3,200 | $16,150 |
| 2015 | $430 | $19,350 | $3,200 | $16,150 |
| 2014 | $430 | $19,350 | $3,200 | $16,150 |
Seller's Agent in 2025
Pamela Keczmer
Howard Hanna
(724) 601-5442
9 in this area
108 Total Sales
Buyer's Agent in 2025
Bridget Wysocki
HOWARD HANNA REAL ESTATE SERVICES
(412) 974-8592
1 in this area
29 Total Sales
Source: West Penn Multi-List
MLS Number: 1728893
APN: 08-046-0909.000
Disclaimer: Certain information contained herein is derived from information provided by parties other than Homes.com. All information provided is deemed reliable, but is not guaranteed to be accurate and should be independently verified.
![]() IDX information is provided exclusively for personal, non-commercial use, and may not be used for any purpose other than to identify prospective properties consumers may be interested in purchasing.
IDX information is provided exclusively for personal, non-commercial use, and may not be used for any purpose other than to identify prospective properties consumers may be interested in purchasing.
Information is deemed reliable but not guaranteed.
Ask me questions while you tour the home.