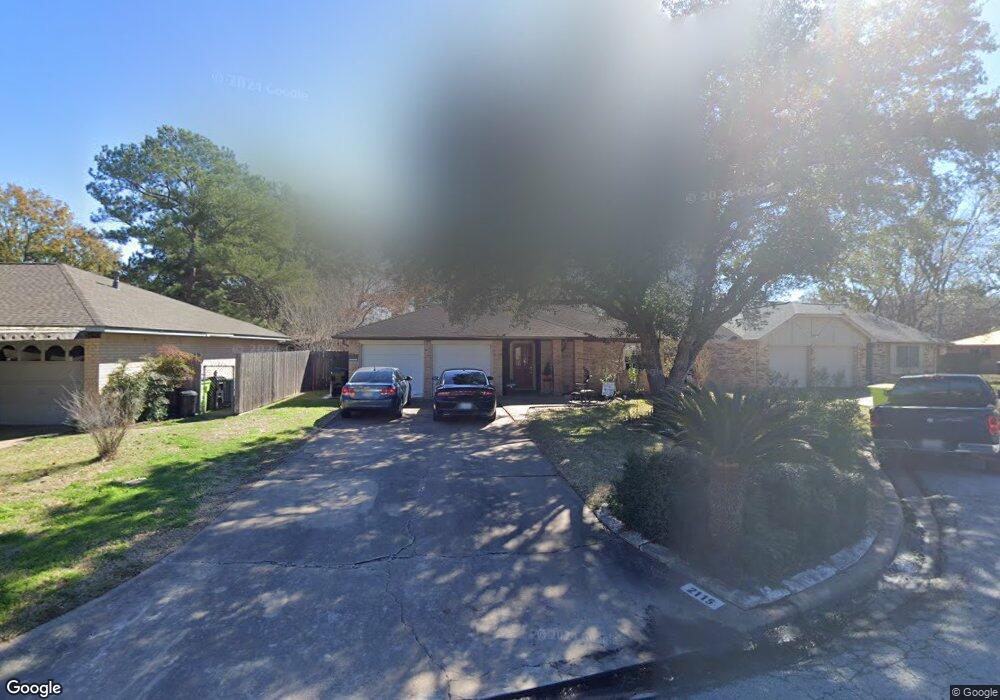
2115 Maple Cir Rosenberg, TX 77471
Estimated Value: $220,000 - $245,000
3
Beds
2
Baths
1,455
Sq Ft
$159/Sq Ft
Est. Value
About This Home
This home is located at 2115 Maple Cir, Rosenberg, TX 77471 and is currently estimated at $231,638, approximately $159 per square foot. 2115 Maple Cir is a home located in Fort Bend County with nearby schools including Travis Elementary School, George Junior High School, and B.F. Terry High School.
Ownership History
Date
Name
Owned For
Owner Type
Purchase Details
Closed on
Sep 22, 2003
Sold by
Salazar Carlos and Salazar Tracie
Bought by
Villegas Blanca L
Current Estimated Value
Home Financials for this Owner
Home Financials are based on the most recent Mortgage that was taken out on this home.
Original Mortgage
$86,400
Outstanding Balance
$40,274
Interest Rate
6.31%
Mortgage Type
New Conventional
Estimated Equity
$191,364
Purchase Details
Closed on
Aug 5, 1998
Sold by
Rodriguez Carlos F and Rodriguez Nora
Bought by
Villegas Blanca L
Purchase Details
Closed on
Feb 28, 1998
Sold by
Rodriguez Carlos F and Rodriguez Nora
Bought by
Salazar Carlos
Home Financials for this Owner
Home Financials are based on the most recent Mortgage that was taken out on this home.
Original Mortgage
$53,125
Interest Rate
6.94%
Mortgage Type
Purchase Money Mortgage
Create a Home Valuation Report for This Property
The Home Valuation Report is an in-depth analysis detailing your home's value as well as a comparison with similar homes in the area
Home Values in the Area
Average Home Value in this Area
Purchase History
| Date | Buyer | Sale Price | Title Company |
|---|---|---|---|
| Villegas Blanca L | -- | -- | |
| Villegas Blanca L | -- | -- | |
| Salazar Carlos | -- | Charter Title Company |
Source: Public Records
Mortgage History
| Date | Status | Borrower | Loan Amount |
|---|---|---|---|
| Open | Villegas Blanca L | $86,400 | |
| Previous Owner | Salazar Carlos | $53,125 | |
| Closed | Salazar Carlos | $3,125 |
Source: Public Records
Tax History
| Year | Tax Paid | Tax Assessment Tax Assessment Total Assessment is a certain percentage of the fair market value that is determined by local assessors to be the total taxable value of land and additions on the property. | Land | Improvement |
|---|---|---|---|---|
| 2025 | $2,673 | $237,658 | $28,600 | $209,058 |
| 2024 | $2,673 | $219,470 | -- | $237,324 |
| 2023 | $2,391 | $199,518 | $0 | $236,256 |
| 2022 | $2,926 | $181,380 | $0 | $194,290 |
| 2021 | $3,421 | $164,890 | $22,000 | $142,890 |
| 2020 | $3,181 | $149,900 | $20,000 | $129,900 |
| 2019 | $3,523 | $154,240 | $20,000 | $134,240 |
| 2018 | $3,338 | $143,810 | $20,000 | $123,810 |
| 2017 | $3,097 | $132,690 | $20,000 | $112,690 |
| 2016 | $2,829 | $121,210 | $20,000 | $101,210 |
| 2015 | $2,159 | $112,520 | $20,000 | $92,520 |
| 2014 | $2,095 | $102,290 | $20,000 | $82,290 |
Source: Public Records
Map
Nearby Homes
- 4605 Greenwood Dr
- 1415 Caslyn Dr
- 1422 Township Ct
- 4901 E Columbary Dr
- 4801 E Columbary Dr
- 5201 Hampton Ct
- 5125 Cotter Ln
- 1733 Brumbelow St
- 1606 Klauke St
- 1802 Junker St
- 1815 Brumbelow St
- 1806 Green Gate Dr
- 1921 Ripple Creek Dr
- 2103 Briar Ridge Dr
- 1733 Jones St
- 1205 Moray Dr
- 4202 Junker St
- 1803 Jones St
- 4707 E Parma Dr
- 2433 Freeway Manor Dr
- 2109 Maple Cir
- 2121 Maple Cir
- 2104 Palm Ct
- 2103 Maple Cir
- 4609 Woodway Ave
- 4613 Woodway Ave
- 2100 Palm Ct
- 4605 Woodway Ave
- 2114 Maple Cir
- 4617 Woodway Ave
- 2108 Maple Cir
- 2118 Maple Cir
- 2108 Palm Ct
- 2122 Maple Cir
- 4601 Woodway Ave
- 2102 Maple Cir
- 4701 Woodway Ave
- 4513 Woodway Ave
- 4705 Woodway Ave
- 4701 Sandalwood Ave
Your Personal Tour Guide
Ask me questions while you tour the home.