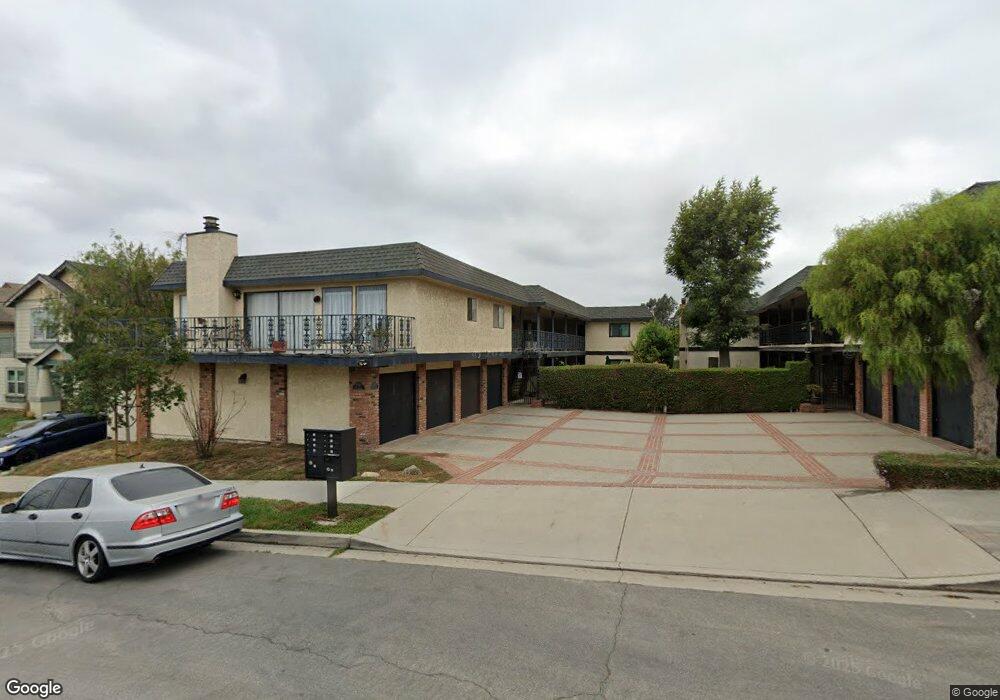
2115 Ohio Ave Unit 2 Signal Hill, CA 90755
Estimated Value: $537,027 - $638,000
2
Beds
2
Baths
1,076
Sq Ft
$550/Sq Ft
Est. Value
About This Home
This home is located at 2115 Ohio Ave Unit 2, Signal Hill, CA 90755 and is currently estimated at $592,257, approximately $550 per square foot. 2115 Ohio Ave Unit 2 is a home located in Los Angeles County with nearby schools including Alvarado Elementary, Nelson Academy, and Woodrow Wilson High School.
Ownership History
Date
Name
Owned For
Owner Type
Purchase Details
Closed on
Nov 7, 2005
Sold by
Workman David J
Bought by
Workman David J and The David J Workman Living Trust
Current Estimated Value
Purchase Details
Closed on
Apr 11, 2003
Sold by
Hackley Dwight
Bought by
Workman David J
Home Financials for this Owner
Home Financials are based on the most recent Mortgage that was taken out on this home.
Original Mortgage
$207,200
Interest Rate
5.87%
Mortgage Type
Purchase Money Mortgage
Purchase Details
Closed on
Jan 14, 2003
Sold by
Hackley Sharon
Bought by
Hackley Dwight
Purchase Details
Closed on
Nov 14, 2002
Sold by
Eastin John D and Eastin Denise K
Bought by
Hackley Dwight
Home Financials for this Owner
Home Financials are based on the most recent Mortgage that was taken out on this home.
Original Mortgage
$175,200
Interest Rate
7.35%
Create a Home Valuation Report for This Property
The Home Valuation Report is an in-depth analysis detailing your home's value as well as a comparison with similar homes in the area
Home Values in the Area
Average Home Value in this Area
Purchase History
| Date | Buyer | Sale Price | Title Company |
|---|---|---|---|
| Workman David J | -- | -- | |
| Workman David J | $259,090 | Southland Title | |
| Hackley Dwight | -- | Orange Coast | |
| Hackley Dwight | $219,000 | Orange Coast Title |
Source: Public Records
Mortgage History
| Date | Status | Borrower | Loan Amount |
|---|---|---|---|
| Previous Owner | Workman David J | $207,200 | |
| Previous Owner | Hackley Dwight | $175,200 | |
| Closed | Hackley Dwight | $43,800 | |
| Closed | Workman David J | $51,800 |
Source: Public Records
Tax History Compared to Growth
Tax History
| Year | Tax Paid | Tax Assessment Tax Assessment Total Assessment is a certain percentage of the fair market value that is determined by local assessors to be the total taxable value of land and additions on the property. | Land | Improvement |
|---|---|---|---|---|
| 2025 | $4,981 | $375,098 | $197,834 | $177,264 |
| 2024 | $4,981 | $367,744 | $193,955 | $173,789 |
| 2023 | $4,898 | $360,534 | $190,152 | $170,382 |
| 2022 | $4,605 | $353,466 | $186,424 | $167,042 |
| 2021 | $4,513 | $346,536 | $182,769 | $163,767 |
| 2020 | $4,498 | $342,983 | $180,895 | $162,088 |
| 2019 | $4,448 | $336,259 | $177,349 | $158,910 |
| 2018 | $4,331 | $329,667 | $173,872 | $155,795 |
| 2016 | $3,995 | $316,868 | $167,121 | $149,747 |
| 2015 | $3,844 | $312,109 | $164,611 | $147,498 |
| 2014 | $3,456 | $274,000 | $145,000 | $129,000 |
Source: Public Records
Map
Nearby Homes
- 2150 Ohio Ave Unit E
- 2199 Ohio Ave
- 2071 Crescent Dr
- 2215 Molino Ave Unit C
- 2265 Ohio Ave
- 2722 E 20th St Unit 104
- 1995 Molino Ave Unit 301
- 2240 Stanley Ave Unit 5
- 2240 Stanley Ave Unit 9
- 1994 Stanley Ave
- 2604 E 20th St Unit 304F
- 1988 Junipero Ave
- 2125 Ridgeview Terrace Dr
- 2700 E Panorama Dr Unit 208
- 2700 E Panorama Dr Unit 402
- 2071 Raymond Ave
- 2575 E 19th St Unit 26
- 2575 E 19th St Unit 38
- 2720 E Wall St
- 1837 Temple Ave Unit C
- 2115 Ohio Ave Unit F
- 2115 Ohio Ave Unit D
- 2115 Ohio Ave Unit 7
- 2115 Ohio Ave Unit 6
- 2115 Ohio Ave Unit 5
- 2115 Ohio Ave Unit 4
- 2115 Ohio Ave Unit 3
- 2115 Ohio Ave Unit 1
- 2109 Ohio Ave
- 2125D Ohio Ave Unit D
- 2125 Ohio Ave Unit G
- 2125 Ohio Ave Unit D
- 2125 Ohio Ave Unit 4-D
- 2125 Ohio Ave Unit 4
- 2125 Ohio Ave Unit 3
- 2125 Ohio Ave Unit 2
- 2125 Ohio Ave Unit 1
- 2125 Ohio Ave Unit 7
- 2125 Ohio Ave Unit 6
- 2125 Ohio Ave Unit 5