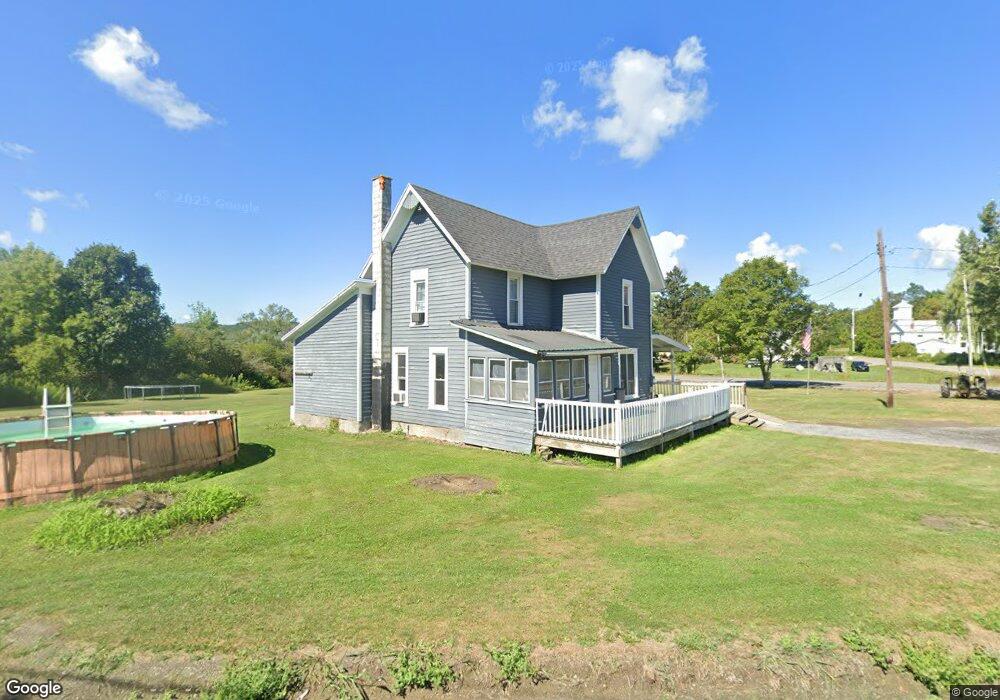
2115 Pulteney Rd Branchport, NY 14418
Estimated Value: $143,000 - $172,425
3
Beds
1
Bath
1,440
Sq Ft
$111/Sq Ft
Est. Value
About This Home
This home is located at 2115 Pulteney Rd, Branchport, NY 14418 and is currently estimated at $159,356, approximately $110 per square foot. 2115 Pulteney Rd is a home located in Yates County with nearby schools including Prattsburgh Central School.
Ownership History
Date
Name
Owned For
Owner Type
Purchase Details
Closed on
Dec 20, 2024
Sold by
Macneal Kori and Slate Kori
Bought by
Hill Shannon
Current Estimated Value
Home Financials for this Owner
Home Financials are based on the most recent Mortgage that was taken out on this home.
Original Mortgage
$145,500
Outstanding Balance
$144,356
Interest Rate
6.79%
Mortgage Type
New Conventional
Estimated Equity
$15,000
Purchase Details
Closed on
Sep 19, 2016
Sold by
Slate Jesse H and Slate Patricia Ann
Bought by
Slate Kori
Purchase Details
Closed on
Dec 8, 2010
Sold by
Slate Jesse and Slate Patricia Ann
Bought by
Turner Karen
Home Financials for this Owner
Home Financials are based on the most recent Mortgage that was taken out on this home.
Original Mortgage
$55,200
Interest Rate
4.17%
Mortgage Type
Purchase Money Mortgage
Create a Home Valuation Report for This Property
The Home Valuation Report is an in-depth analysis detailing your home's value as well as a comparison with similar homes in the area
Home Values in the Area
Average Home Value in this Area
Purchase History
| Date | Buyer | Sale Price | Title Company |
|---|---|---|---|
| Hill Shannon | $150,000 | Revolution Title Agency | |
| Slate Kori | $5,000 | None Available | |
| Slate Kori | $5,000 | None Available | |
| Slate Kori | $5,000 | None Available | |
| Turner Karen | $69,000 | Robert Plaskov | |
| Turner Karen | $69,000 | Robert Plaskov |
Source: Public Records
Mortgage History
| Date | Status | Borrower | Loan Amount |
|---|---|---|---|
| Open | Hill Shannon | $145,500 | |
| Previous Owner | Turner Karen | $55,200 |
Source: Public Records
Tax History Compared to Growth
Tax History
| Year | Tax Paid | Tax Assessment Tax Assessment Total Assessment is a certain percentage of the fair market value that is determined by local assessors to be the total taxable value of land and additions on the property. | Land | Improvement |
|---|---|---|---|---|
| 2024 | $3,577 | $162,000 | $17,400 | $144,600 |
| 2023 | $3,554 | $125,900 | $15,300 | $110,600 |
| 2022 | $3,445 | $125,900 | $15,300 | $110,600 |
| 2021 | $3,470 | $125,900 | $15,300 | $110,600 |
| 2020 | $2,221 | $76,000 | $15,200 | $60,800 |
| 2019 | $2,260 | $76,000 | $15,200 | $60,800 |
| 2018 | $2,260 | $76,000 | $15,200 | $60,800 |
| 2017 | $2,142 | $70,000 | $15,200 | $54,800 |
| 2016 | $1,675 | $70,000 | $15,200 | $54,800 |
| 2015 | -- | $70,000 | $15,200 | $54,800 |
| 2014 | -- | $70,000 | $15,200 | $54,800 |
Source: Public Records
Map
Nearby Homes
- 2271 Dunn Rd
- 5321 Highlands Dr
- 3064 Big Horn
- 5515 Highlands Dr
- 3000 Tom Campbell Rd
- 11688 McMichael Rd (East Side)
- 130 Wetherby Rd
- 11672 Davis Rd
- 6088 Italy Valley Rd
- 11231 Gloades Corners Rd
- 9447 County Route 75
- 0 Wessie Rd
- 3300 Sliter Hill Rd
- 6891 New York 53
- 3611 Shay Rd
- 8062 Brown Rd
- 8989 Chidsey Hill Rd
- 2507 Shanty Plains Rd
- 3766 Italy Hill Rd
- VL Brown Rd
- 2905 Italy Hill Turnpike
- 2116 Italy Hill Rd
- 2121 Pulver Rd
- 2121 Italy Hill Rd
- 2145 Pulteney Rd
- 2900 Italy Hill Turnpike
- 2895 Italy Hill Turnpike
- 2875 Italy Hill Turnpike
- 2880 Italy Hill Turnpike
- 2880 Italy Hill Turnpike
- 2185 Italy Hill Rd
- 2063 Pulver Rd
- 2815 Italy Hill Turnpike
- 2870 Italy Hill Turnpike
- 2201 Pulteney Rd
- 2051 Italy Hill Rd
- 2051 Italy Hill Rd
- 2238 Italy Hill Rd
- 5150 Italy Hill Rd
- 4698 Italy Friend Rd