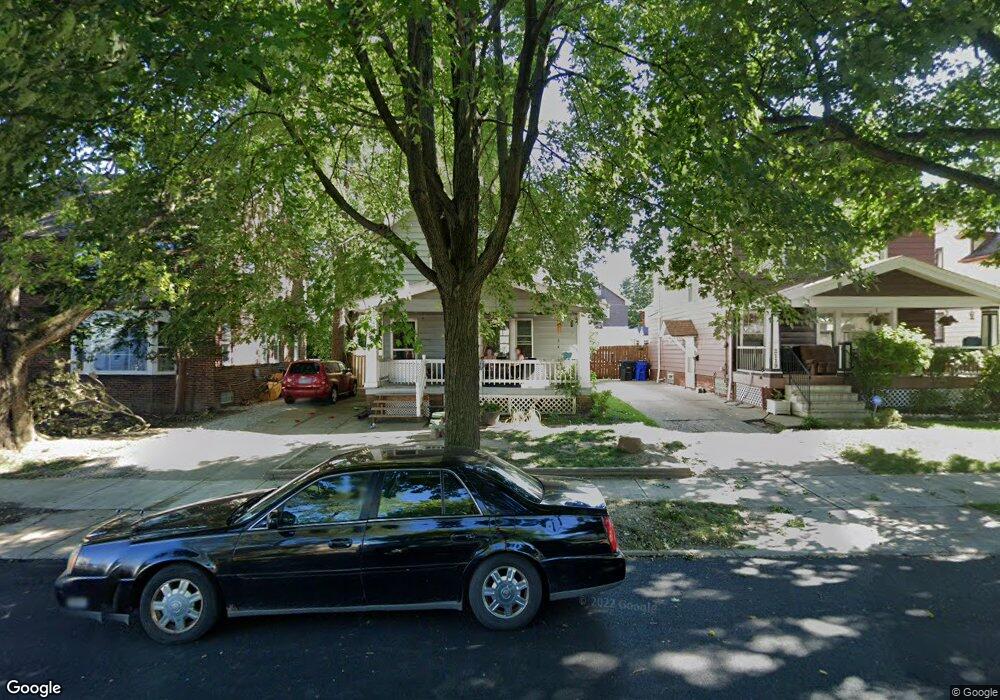
2115 Tate Ave Cleveland, OH 44109
Old Brooklyn NeighborhoodEstimated Value: $135,392 - $174,000
3
Beds
1
Bath
1,264
Sq Ft
$120/Sq Ft
Est. Value
About This Home
This home is located at 2115 Tate Ave, Cleveland, OH 44109 and is currently estimated at $151,098, approximately $119 per square foot. 2115 Tate Ave is a home located in Cuyahoga County with nearby schools including Benjamin Franklin, Almira Academy, and Artemus Ward School.
Ownership History
Date
Name
Owned For
Owner Type
Purchase Details
Closed on
Nov 14, 1994
Sold by
Alvarez Vittorio P
Bought by
Batt Paul J and Batt Kelly M
Current Estimated Value
Home Financials for this Owner
Home Financials are based on the most recent Mortgage that was taken out on this home.
Original Mortgage
$51,400
Interest Rate
8.86%
Mortgage Type
New Conventional
Purchase Details
Closed on
Mar 23, 1990
Sold by
Difranco Sue Ellen
Bought by
Alvarez Vittorio P
Purchase Details
Closed on
Oct 25, 1985
Sold by
Difranco Donald C
Bought by
Difranco Sue Ellen
Purchase Details
Closed on
Aug 3, 1978
Sold by
Raymond Robert Rusnak
Bought by
Difranco Donald C
Purchase Details
Closed on
Aug 9, 1977
Sold by
Rusnak Raymond R
Bought by
Raymond Robert Rusnak
Purchase Details
Closed on
Jan 12, 1976
Sold by
Holt Richard T and Holt Sharon A
Bought by
Rusnak Raymond R
Purchase Details
Closed on
Jan 1, 1975
Bought by
Holt Richard T and Holt Sharon A
Create a Home Valuation Report for This Property
The Home Valuation Report is an in-depth analysis detailing your home's value as well as a comparison with similar homes in the area
Home Values in the Area
Average Home Value in this Area
Purchase History
| Date | Buyer | Sale Price | Title Company |
|---|---|---|---|
| Batt Paul J | $53,000 | -- | |
| Alvarez Vittorio P | $41,500 | -- | |
| Difranco Sue Ellen | -- | -- | |
| Difranco Donald C | $33,900 | -- | |
| Raymond Robert Rusnak | -- | -- | |
| Rusnak Raymond R | $26,500 | -- | |
| Holt Richard T | -- | -- |
Source: Public Records
Mortgage History
| Date | Status | Borrower | Loan Amount |
|---|---|---|---|
| Closed | Batt Paul J | $51,400 |
Source: Public Records
Tax History Compared to Growth
Tax History
| Year | Tax Paid | Tax Assessment Tax Assessment Total Assessment is a certain percentage of the fair market value that is determined by local assessors to be the total taxable value of land and additions on the property. | Land | Improvement |
|---|---|---|---|---|
| 2024 | $2,614 | $39,865 | $7,315 | $32,550 |
| 2023 | $1,869 | $24,640 | $5,040 | $19,600 |
| 2022 | $2,375 | $24,640 | $5,040 | $19,600 |
| 2021 | $1,839 | $24,640 | $5,040 | $19,600 |
| 2020 | $1,650 | $19,110 | $3,920 | $15,190 |
| 2019 | $1,526 | $54,600 | $11,200 | $43,400 |
| 2018 | $1,521 | $19,110 | $3,920 | $15,190 |
| 2017 | $1,525 | $18,490 | $3,050 | $15,440 |
| 2016 | $1,513 | $18,490 | $3,050 | $15,440 |
| 2015 | $1,688 | $18,490 | $3,050 | $15,440 |
| 2014 | $1,688 | $20,550 | $3,400 | $17,150 |
Source: Public Records
Map
Nearby Homes
- 2219 Hood Ave
- 2101 Broadview Rd
- 2312 Roanoke Ave Unit 1-2
- 1825 Treadway Ave
- 1905 Creston Ave
- 4233 Valley Rd
- 4490 Broadale Rd
- 4491 W 30th St
- 2810 Natchez Ave
- 4226 Valley Rd
- 2815 Tampa Ave
- 4267 W 21st St
- 2802 Saratoga Ave
- 2802 Colburn Ave
- 1917 Cypress Ave
- 4463 S Hills Dr
- 4295 W 30th St
- 4302 W 30th St
- 1516 Amberley Ave
- 4475 W 12th St
- 2119 Tate Ave
- 2203 Tate Ave
- 4450 Broadview Rd
- 4460 Broadview Rd
- 2116 Hood Ave
- 2202 Hood Ave
- 2207 Tate Ave
- 4450 4456 Broadview Rd
- 4450 4456 Broadview Rd Unit 4456
- 4456 Broadview Rd Unit 4456
- 2206 Hood Ave
- 4466 Broadview Rd
- 2211 Tate Ave
- 2202 Tate Ave
- 2210 Hood Ave
- 4468 Broadview Rd
- 2118 Tate Ave
- 2007 Broadview Rd
- 2200 Tate Ave
- 2214 Hood Ave