Estimated Value: $319,000 - $344,000
5
Beds
3
Baths
2,100
Sq Ft
$157/Sq Ft
Est. Value
About This Home
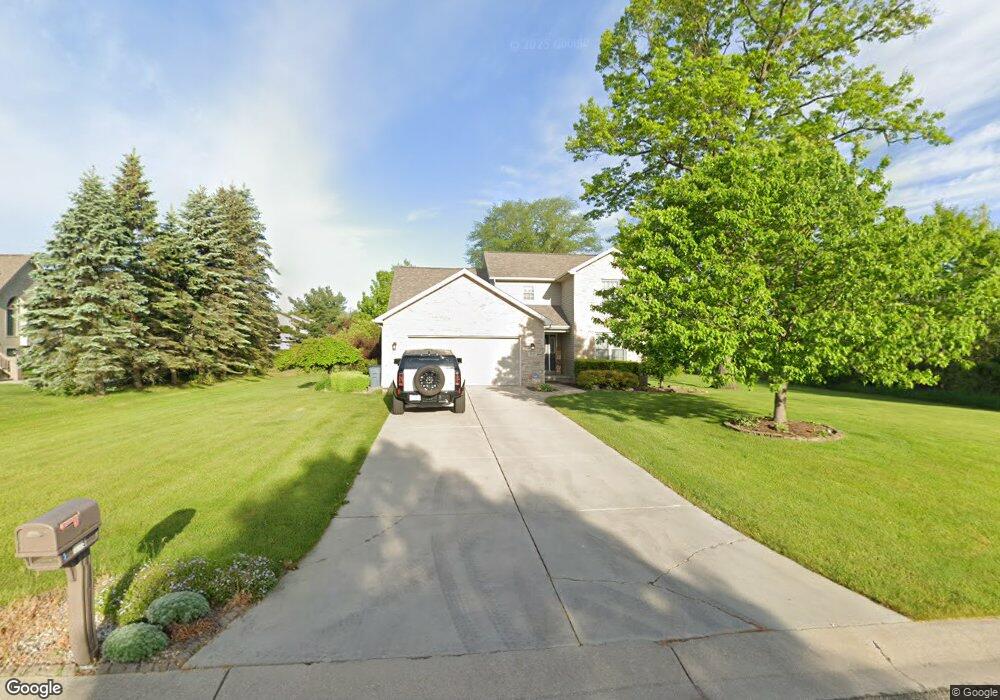
This home is located at 2115 Walnut Creek Dr Unit 31, Flint, MI 48532 and is currently estimated at $330,146, approximately $157 per square foot. 2115 Walnut Creek Dr Unit 31 is a home located in Genesee County with nearby schools including Springview Elementary School, Flushing Middle School, and Flushing High School.
Ownership History
Date
Name
Owned For
Owner Type
Purchase Details
Closed on
Mar 24, 2010
Sold by
Seaman Richard N and Seaman Leticia
Bought by
Federal Home Loan Mortgage Corp
Current Estimated Value
Purchase Details
Closed on
Jun 30, 2006
Sold by
Seaman Richard N
Bought by
Seaman Richard N and Seaman Leticia
Home Financials for this Owner
Home Financials are based on the most recent Mortgage that was taken out on this home.
Original Mortgage
$236,000
Interest Rate
6.72%
Mortgage Type
New Conventional
Purchase Details
Closed on
Sep 22, 2003
Sold by
Seaman Stacy L
Bought by
Seaman Richard N
Purchase Details
Closed on
Aug 10, 2001
Sold by
Hrc Building Co Inc
Bought by
Seaman Richard N and Seaman Stacy L
Create a Home Valuation Report for This Property
The Home Valuation Report is an in-depth analysis detailing your home's value as well as a comparison with similar homes in the area
Home Values in the Area
Average Home Value in this Area
Purchase History
| Date | Buyer | Sale Price | Title Company |
|---|---|---|---|
| Federal Home Loan Mortgage Corp | $131,000 | None Available | |
| Seaman Richard N | -- | Title Source Inc | |
| Seaman Richard N | -- | -- | |
| Seaman Richard N | $234,000 | Cislo Title Company | |
| Hrc Building Company Inc | -- | Cislo Title Company |
Source: Public Records
Mortgage History
| Date | Status | Borrower | Loan Amount |
|---|---|---|---|
| Previous Owner | Seaman Richard N | $236,000 |
Source: Public Records
Tax History Compared to Growth
Tax History
| Year | Tax Paid | Tax Assessment Tax Assessment Total Assessment is a certain percentage of the fair market value that is determined by local assessors to be the total taxable value of land and additions on the property. | Land | Improvement |
|---|---|---|---|---|
| 2025 | $3,997 | $144,900 | $0 | $0 |
| 2024 | $2,099 | $154,200 | $0 | $0 |
| 2023 | $2,004 | $143,900 | $0 | $0 |
| 2022 | $1,700 | $130,100 | $0 | $0 |
| 2021 | $3,525 | $121,300 | $0 | $0 |
| 2020 | $1,878 | $106,200 | $0 | $0 |
| 2019 | $1,859 | $93,300 | $0 | $0 |
| 2018 | $3,302 | $86,100 | $0 | $0 |
| 2017 | $3,067 | $86,100 | $0 | $0 |
| 2016 | $3,091 | $82,500 | $0 | $0 |
| 2015 | $2,880 | $82,300 | $0 | $0 |
| 2014 | $1,636 | $78,300 | $0 | $0 |
| 2012 | -- | $73,500 | $73,500 | $0 |
Source: Public Records
Map
Nearby Homes
- 5442 Meadow Creek Ct
- 5411 River Meadow Blvd
- 6123 E River Rd
- 2218 Disch St
- 2340 Pineview Ct
- 2371 Pineview Ct
- 00 Emeraldwood Trail
- 2372 Meadow St
- 2008 Beekman Ct
- 74 Emeraldwood Trail
- 60 Emeraldwood Trail
- 1391 Dye Krest Cir
- 5551 Sugar Bush Ln
- 2296 Stonefield Dr
- 1517 Rio Grande Ct
- 5204 Pasadena Ave
- 6318 Laurentian Ct Unit Building 9 APT 42
- 5104 Shady Oak Trail
- 5021 Forest Side Dr
- 6302 Laurentian Ct
- 5402 Sycamore Ln Unit 32
- 5408 Sycamore Ln Unit 33
- 5416 Sycamore Ln Unit 34
- 5424 Sycamore Ln Unit 35
- 2112 Walnut Creek Dr Unit 25
- 2104 Walnut Creek Dr Unit 24
- 5399 Sycamore Ln Unit 27
- 2120 Walnut Creek Dr Unit 26
- 5407 Sycamore Ln Unit 28
- 2088 Walnut Creek Dr Unit 16
- 5432 Sycamore Ln Unit 36
- 5415 Sycamore Ln Unit 29
- 2096 Walnut Creek Dr Unit 23
- 5423 Sycamore Ln Unit 30
- 5440 Sycamore Ln Unit 37
- 5431 Sycamore Ln Unit 39
- 5412 Misty Creek Ct Unit 21
- 5404 Misty Creek Ct Unit 22
- 2080 Walnut Creek Dr Unit 15
- 5439 Sycamore Ln Unit 40