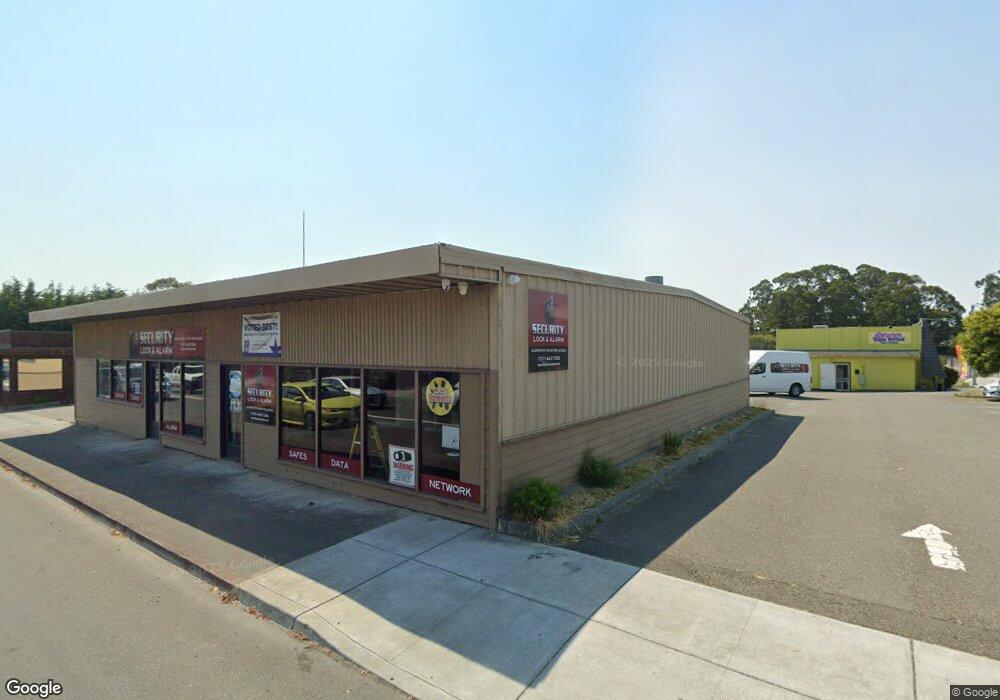
2116 4th St Eureka, CA 95501
City Center Neighborhood
Studio
--
Bath
3,900
Sq Ft
7,841
Sq Ft Lot
About This Home
This home is located at 2116 4th St, Eureka, CA 95501. 2116 4th St is a home located in Humboldt County with nearby schools including Lafayette Elementary School, Catherine L. Zane Middle School, and Eureka Senior High School.
Ownership History
Date
Name
Owned For
Owner Type
Purchase Details
Closed on
Nov 21, 2018
Sold by
Trinity Systems Llc
Bought by
Low Voltage Security
Home Financials for this Owner
Home Financials are based on the most recent Mortgage that was taken out on this home.
Original Mortgage
$1,265,000
Outstanding Balance
$1,112,400
Interest Rate
4.9%
Mortgage Type
Purchase Money Mortgage
Purchase Details
Closed on
Nov 15, 2018
Sold by
Trinity Systems Llc
Bought by
Low Voltage Security
Home Financials for this Owner
Home Financials are based on the most recent Mortgage that was taken out on this home.
Original Mortgage
$1,265,000
Outstanding Balance
$1,112,400
Interest Rate
4.9%
Mortgage Type
Purchase Money Mortgage
Purchase Details
Closed on
Dec 20, 2004
Sold by
The City Of Eureka
Bought by
Stone Jon L and Stone Mary E
Purchase Details
Closed on
Dec 31, 2002
Sold by
Stone Sonia M
Bought by
Stone Jon L and Stone Mary E
Create a Home Valuation Report for This Property
The Home Valuation Report is an in-depth analysis detailing your home's value as well as a comparison with similar homes in the area
Home Values in the Area
Average Home Value in this Area
Purchase History
| Date | Buyer | Sale Price | Title Company |
|---|---|---|---|
| Low Voltage Security | -- | -- | |
| Low Voltage Security | -- | -- | |
| Trinity Systems Llc | $700,000 | Fidelity National Title | |
| Low Voltage Security | -- | -- | |
| Stone Jon L | $4,500 | -- | |
| Stone Jon L | $45,500 | -- |
Source: Public Records
Mortgage History
| Date | Status | Borrower | Loan Amount |
|---|---|---|---|
| Open | Trinity Systems Llc | $1,265,000 |
Source: Public Records
Tax History
| Year | Tax Paid | Tax Assessment Tax Assessment Total Assessment is a certain percentage of the fair market value that is determined by local assessors to be the total taxable value of land and additions on the property. | Land | Improvement |
|---|---|---|---|---|
| 2025 | $8,031 | $780,857 | $223,101 | $557,756 |
| 2024 | $8,031 | $765,547 | $218,727 | $546,820 |
| 2023 | $7,918 | $750,538 | $214,439 | $536,099 |
| 2022 | $8,219 | $735,823 | $210,235 | $525,588 |
| 2021 | $7,697 | $721,396 | $206,113 | $515,283 |
| 2020 | $7,640 | $714,000 | $204,000 | $510,000 |
| 2019 | $7,483 | $700,000 | $200,000 | $500,000 |
| 2018 | $2,298 | $213,988 | $114,127 | $99,861 |
| 2017 | $2,287 | $209,793 | $111,890 | $97,903 |
| 2016 | $2,287 | $205,681 | $109,697 | $95,984 |
| 2015 | $2,267 | $202,593 | $108,050 | $94,543 |
| 2014 | $2,119 | $198,626 | $105,934 | $92,692 |
Source: Public Records
Map
Nearby Homes