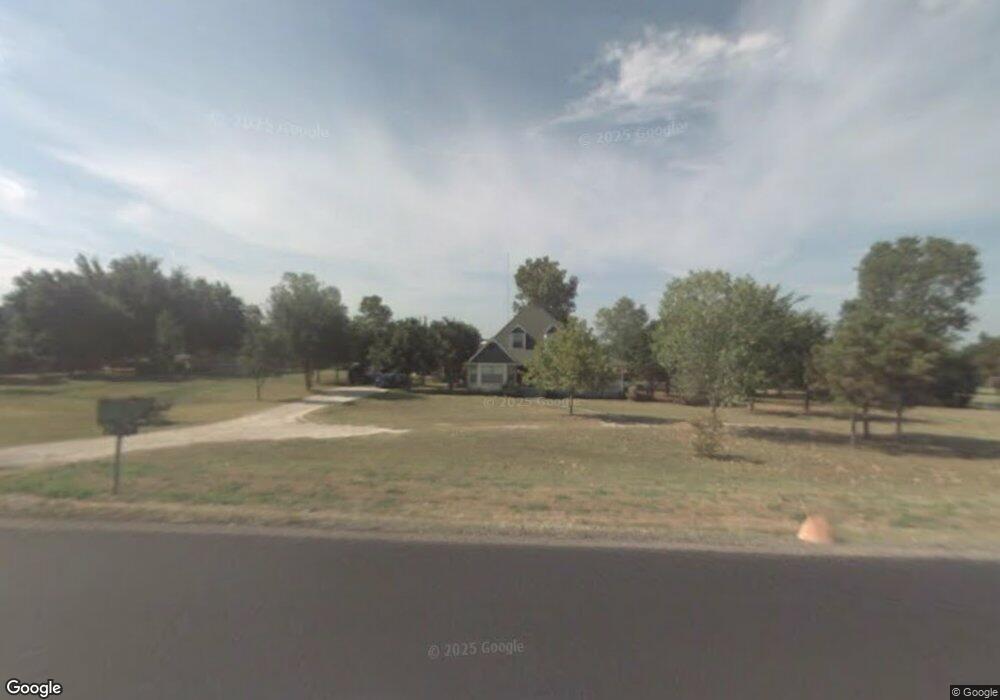
2116 Fm 3048 Cleburne, TX 76031
Estimated Value: $353,751 - $451,000
3
Beds
3
Baths
2,265
Sq Ft
$184/Sq Ft
Est. Value
About This Home
This home is located at 2116 Fm 3048, Cleburne, TX 76031 and is currently estimated at $417,688, approximately $184 per square foot. 2116 Fm 3048 is a home located in Johnson County with nearby schools including Plum Creek Elementary School, Joshua High School - 9th Grade Campus, and Joshua High School.
Ownership History
Date
Name
Owned For
Owner Type
Purchase Details
Closed on
Jun 29, 2018
Sold by
G & G Investment Properties Llc
Bought by
Clapsaddle Diane M and Simmons Christopher
Current Estimated Value
Home Financials for this Owner
Home Financials are based on the most recent Mortgage that was taken out on this home.
Original Mortgage
$265,109
Outstanding Balance
$229,243
Interest Rate
4.4%
Mortgage Type
FHA
Estimated Equity
$188,445
Purchase Details
Closed on
Feb 2, 2018
Sold by
Ska Properties Llc
Bought by
G And G Investment Properties Llc
Purchase Details
Closed on
Aug 11, 2015
Sold by
Alcala Jose J and Alcala Crystal D
Bought by
Alcala Jose J
Home Financials for this Owner
Home Financials are based on the most recent Mortgage that was taken out on this home.
Original Mortgage
$22,908
Interest Rate
4.08%
Mortgage Type
Purchase Money Mortgage
Create a Home Valuation Report for This Property
The Home Valuation Report is an in-depth analysis detailing your home's value as well as a comparison with similar homes in the area
Home Values in the Area
Average Home Value in this Area
Purchase History
| Date | Buyer | Sale Price | Title Company |
|---|---|---|---|
| Clapsaddle Diane M | -- | None Available | |
| G And G Investment Properties Llc | -- | Capital Title | |
| Alcala Jose J | -- | None Available |
Source: Public Records
Mortgage History
| Date | Status | Borrower | Loan Amount |
|---|---|---|---|
| Open | Clapsaddle Diane M | $265,109 | |
| Previous Owner | Alcala Jose J | $22,908 |
Source: Public Records
Tax History Compared to Growth
Tax History
| Year | Tax Paid | Tax Assessment Tax Assessment Total Assessment is a certain percentage of the fair market value that is determined by local assessors to be the total taxable value of land and additions on the property. | Land | Improvement |
|---|---|---|---|---|
| 2025 | $3,554 | $279,259 | $85,000 | $194,259 |
| 2024 | $4,871 | $279,259 | $85,000 | $194,259 |
| 2023 | $2,958 | $259,259 | $65,000 | $194,259 |
| 2022 | $4,660 | $259,259 | $65,000 | $194,259 |
| 2021 | $4,389 | $0 | $0 | $0 |
| 2020 | $4,325 | $219,259 | $25,000 | $194,259 |
| 2019 | $5,496 | $261,490 | $25,000 | $236,490 |
| 2018 | $2,670 | $150,421 | $25,000 | $125,421 |
| 2017 | $2,425 | $111,266 | $25,000 | $86,266 |
| 2016 | $2,425 | $111,266 | $25,000 | $86,266 |
| 2015 | $1,857 | $111,266 | $25,000 | $86,266 |
| 2014 | $1,857 | $111,266 | $25,000 | $86,266 |
Source: Public Records
Map
Nearby Homes
- 2341 Oak Leaf Trail
- 2820 County Road 805b
- 2812 County Road 805b
- 2517 County Road 805b
- 1105 Snowberry St
- 2720 Hill Ln
- Lot 7 W Oakdale St
- 416 Linden St
- 503 N Fairview St Unit LOT 46
- 1043 County Road 701a
- TBD County Road 701a
- 615 W Hillcrest St
- 102 Shady Oak Rd
- 206 E Maple St
- 407 E Oakdale St
- 4433 County Road 801
- 406 N Eastern St
- 529 Neely Ln
- 107 Rosedale Ave
- 305 N Eastern St
- 3813 County Road 805
- 3809 County Road 805
- 3900 County Road 805
- 2100 Fm 3048
- 3801 County Road 805
- 2117 Fm 3048
- 2125 Fm 3048
- 2209 Fm 3048
- 3924 County Road 805
- 2211 Fm 3048
- 2319 County Road 704b Unit 2321
- 2319 County Road 704b
- 2213 Fm 3048
- 2332 Oak Leaf Trail
- 2319 County Road 417a
- 3728 County Road 805
- 2217 Fm 3048
- 2324 Oak Leaf Trail
- 2223 Fm 3048
- 4017 County Road 805