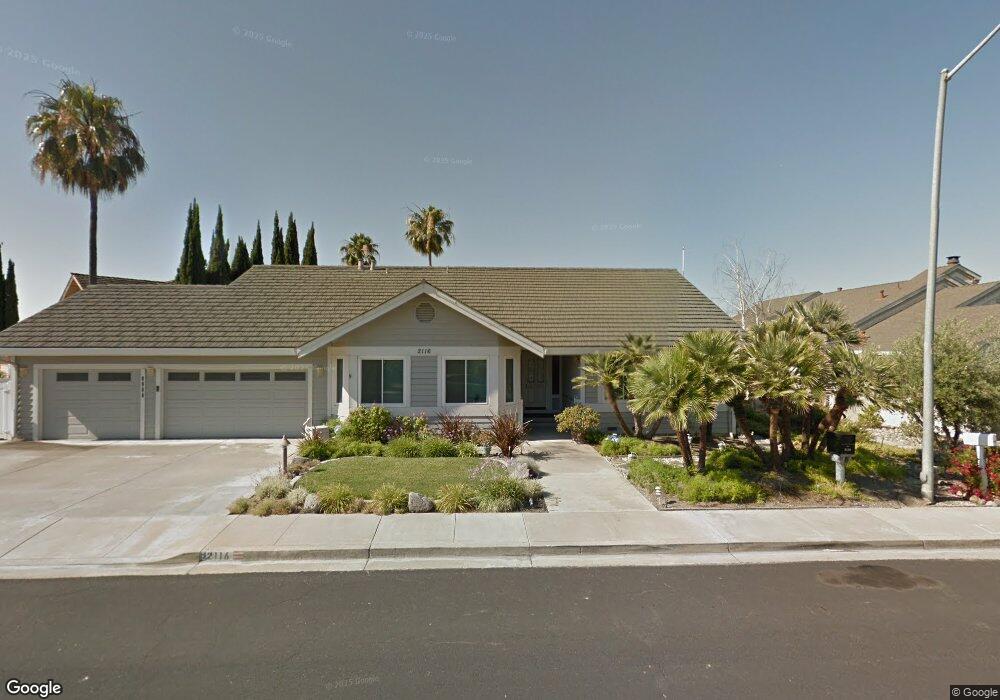
2116 Sand Point Rd Discovery Bay, CA 94505
Estimated Value: $977,000 - $1,193,000
4
Beds
3
Baths
3,151
Sq Ft
$342/Sq Ft
Est. Value
About This Home
This home is located at 2116 Sand Point Rd, Discovery Bay, CA 94505 and is currently estimated at $1,076,953, approximately $341 per square foot. 2116 Sand Point Rd is a home located in Contra Costa County with nearby schools including Discovery Bay Elementary School, Excelsior Middle School, and Liberty High School.
Ownership History
Date
Name
Owned For
Owner Type
Purchase Details
Closed on
Dec 3, 2020
Sold by
Mccullough Lyndelle J
Bought by
Mccullough Lyndelle J and Mccullough Lyndelle J
Current Estimated Value
Purchase Details
Closed on
Jul 10, 2020
Sold by
Russell William
Bought by
Mccullough Lyndelle J
Home Financials for this Owner
Home Financials are based on the most recent Mortgage that was taken out on this home.
Original Mortgage
$375,000
Outstanding Balance
$332,525
Interest Rate
3.1%
Mortgage Type
New Conventional
Estimated Equity
$744,428
Purchase Details
Closed on
Apr 28, 2008
Sold by
Jones Calvin and Jones Susan M
Bought by
Russell William
Purchase Details
Closed on
Apr 9, 2002
Sold by
Sealy Eleanor M
Bought by
Jones Calvin and Jones Susan M
Home Financials for this Owner
Home Financials are based on the most recent Mortgage that was taken out on this home.
Original Mortgage
$492,000
Interest Rate
5.09%
Mortgage Type
Purchase Money Mortgage
Create a Home Valuation Report for This Property
The Home Valuation Report is an in-depth analysis detailing your home's value as well as a comparison with similar homes in the area
Home Values in the Area
Average Home Value in this Area
Purchase History
| Date | Buyer | Sale Price | Title Company |
|---|---|---|---|
| Mccullough Lyndelle J | -- | None Available | |
| Mccullough Lyndelle J | $875,000 | Chicago Title Company | |
| Mccullough Lyndelle J | -- | Chicago Title Company | |
| Russell William | $825,000 | Fidelity National Title Comp | |
| Jones Calvin | $615,000 | North American Title Co |
Source: Public Records
Mortgage History
| Date | Status | Borrower | Loan Amount |
|---|---|---|---|
| Open | Mccullough Lyndelle J | $375,000 | |
| Previous Owner | Jones Calvin | $492,000 |
Source: Public Records
Tax History
| Year | Tax Paid | Tax Assessment Tax Assessment Total Assessment is a certain percentage of the fair market value that is determined by local assessors to be the total taxable value of land and additions on the property. | Land | Improvement |
|---|---|---|---|---|
| 2025 | $10,235 | $947,126 | $357,201 | $589,925 |
| 2024 | $11,441 | $928,556 | $350,198 | $578,358 |
| 2023 | $11,441 | $910,350 | $343,332 | $567,018 |
| 2022 | $11,264 | $892,500 | $336,600 | $555,900 |
| 2021 | $11,003 | $875,000 | $330,000 | $545,000 |
| 2019 | $11,473 | $904,000 | $383,514 | $520,486 |
| 2018 | $10,759 | $859,500 | $364,635 | $494,865 |
| 2017 | $10,873 | $856,500 | $363,362 | $493,138 |
| 2016 | $10,673 | $842,000 | $357,211 | $484,789 |
| 2015 | $9,620 | $750,000 | $318,181 | $431,819 |
| 2014 | $9,075 | $701,500 | $297,605 | $403,895 |
Source: Public Records
Map
Nearby Homes
- 2033 Sand Point Rd
- 1802 Dolphin Place
- 1642 Dune Point Ct
- 2013 Sand Point Rd
- 2073 Sand Point Rd
- 2079 Sand Point Rd
- 1864 Dune Point Way
- 5090 Double Point Way
- 2205 Breaker Ct
- 2110 Largo Ct
- 5034 Double Point Way
- 4814 South Point
- 910 Discovery Bay Blvd
- 4681 Spinnaker Way
- 4691 Spinnaker Way
- 1933 Windward Point
- 1240 Marina Cir
- 2102 Portside Ct
- 2101 Portside Ct
- 1944 Windward Point
- 1707 Dolphin Place
- 2126 Sand Point Rd
- 2115 Sand Point Rd
- 2105 Sand Point Rd
- 2125 Sand Point Rd
- 1727 Dolphin Place
- 2146 Sand Point Rd
- 2135 Sand Point Rd
- 2096 Sand Point Rd
- 1737 Dolphin Place
- 1730 Riverlake Rd
- 2145 Sand Point Rd
- 2156 Sand Point Rd
- 1722 Dolphin Place
- 1747 Dolphin Place
- 2086 Sand Point Rd
- 2155 Sand Point Rd
- 1732 Dolphin Place
- 1720 Riverlake Rd
- 2166 Sand Point Rd
Your Personal Tour Guide
Ask me questions while you tour the home.