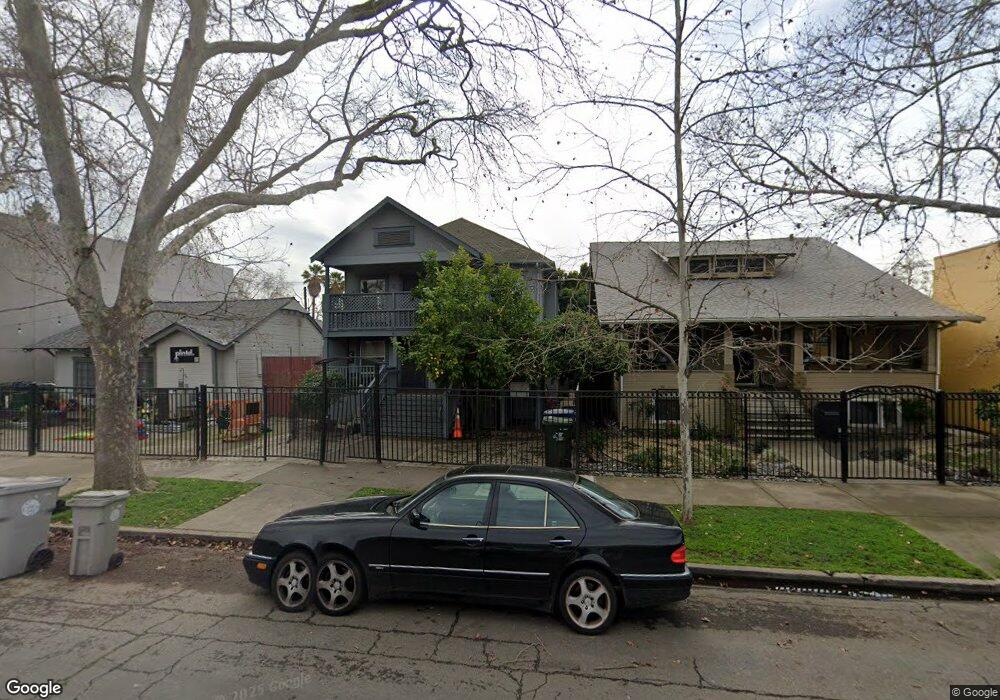
2116 X St Sacramento, CA 95818
Curtis Park NeighborhoodEstimated Value: $680,000 - $1,059,000
8
Beds
4
Baths
3,038
Sq Ft
$292/Sq Ft
Est. Value
About This Home
This home is located at 2116 X St, Sacramento, CA 95818 and is currently estimated at $886,333, approximately $291 per square foot. 2116 X St is a home located in Sacramento County with nearby schools including William Land Elementary School, Miwok Middle School, and C. K. McClatchy High.
Ownership History
Date
Name
Owned For
Owner Type
Purchase Details
Closed on
Feb 19, 2021
Sold by
Bulfinch Cynthia A and Bulfinch Cynthia A
Bought by
Pcr Holdings Llc
Current Estimated Value
Home Financials for this Owner
Home Financials are based on the most recent Mortgage that was taken out on this home.
Original Mortgage
$600,000
Outstanding Balance
$536,634
Interest Rate
2.7%
Mortgage Type
Commercial
Estimated Equity
$349,699
Purchase Details
Closed on
Feb 6, 2020
Sold by
Bulfinch Cynthia A
Bought by
Bulfinch Cynthia A and The Cynthia A Bulfinch Revocab
Purchase Details
Closed on
Jun 13, 2019
Sold by
Bulfinch Gary L
Bought by
Bulfinch Gary L and Bulfinch Cynthia A
Purchase Details
Closed on
Oct 13, 2006
Sold by
Bulfinch Elizabeth A
Bought by
Bulfinch Gary L
Create a Home Valuation Report for This Property
The Home Valuation Report is an in-depth analysis detailing your home's value as well as a comparison with similar homes in the area
Home Values in the Area
Average Home Value in this Area
Purchase History
| Date | Buyer | Sale Price | Title Company |
|---|---|---|---|
| Pcr Holdings Llc | $875,000 | Placer Title Company | |
| Bulfinch Cynthia A | -- | None Available | |
| Bulfinch Cynthia A | -- | None Available | |
| Bulfinch Gary L | -- | None Available | |
| Bulfinch Gary L | -- | None Available |
Source: Public Records
Mortgage History
| Date | Status | Borrower | Loan Amount |
|---|---|---|---|
| Open | Pcr Holdings Llc | $600,000 |
Source: Public Records
Tax History Compared to Growth
Tax History
| Year | Tax Paid | Tax Assessment Tax Assessment Total Assessment is a certain percentage of the fair market value that is determined by local assessors to be the total taxable value of land and additions on the property. | Land | Improvement |
|---|---|---|---|---|
| 2025 | $8,854 | $703,579 | $389,674 | $313,905 |
| 2024 | $8,854 | $689,784 | $382,034 | $307,750 |
| 2023 | $8,652 | $676,260 | $374,544 | $301,716 |
| 2022 | $8,509 | $663,000 | $367,200 | $295,800 |
| 2021 | $2,771 | $174,390 | $36,778 | $137,612 |
| 2020 | $2,770 | $172,602 | $36,401 | $136,201 |
| 2019 | $2,713 | $169,219 | $35,688 | $133,531 |
| 2018 | $2,643 | $165,902 | $34,989 | $130,913 |
| 2017 | $2,610 | $162,650 | $34,303 | $128,347 |
| 2016 | $2,382 | $159,462 | $33,631 | $125,831 |
| 2015 | $2,348 | $157,067 | $33,126 | $123,941 |
| 2014 | $2,295 | $153,992 | $32,478 | $121,514 |
Source: Public Records
Map
Nearby Homes