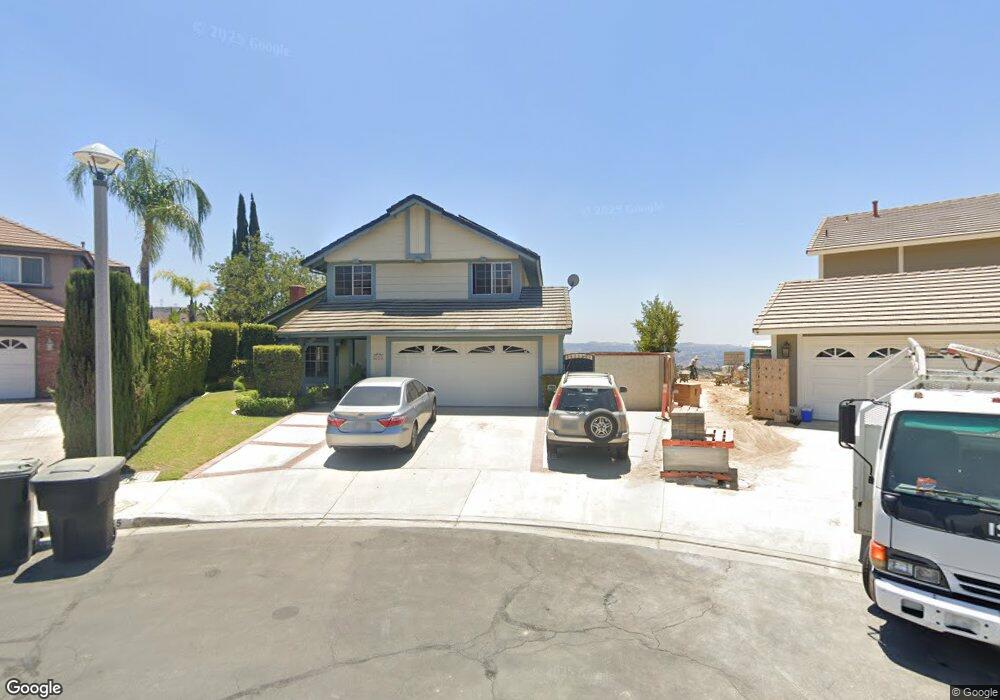
21165 Castlerock Rd Yorba Linda, CA 92886
Estimated Value: $1,735,497 - $1,906,000
5
Beds
3
Baths
2,724
Sq Ft
$668/Sq Ft
Est. Value
About This Home
This home is located at 21165 Castlerock Rd, Yorba Linda, CA 92886 and is currently estimated at $1,819,374, approximately $667 per square foot. 21165 Castlerock Rd is a home located in Orange County with nearby schools including Fairmont Elementary, Bernardo Yorba Middle School, and Yorba Linda High School.
Ownership History
Date
Name
Owned For
Owner Type
Purchase Details
Closed on
Jan 17, 2019
Sold by
Ward Dennis A and Ward Anna M
Bought by
Ward Dennis A and Ward Anna M
Current Estimated Value
Purchase Details
Closed on
Aug 27, 2003
Sold by
Ward Dennis A and Ward Anna M
Bought by
Ward Dennis A and Ward Anna M
Home Financials for this Owner
Home Financials are based on the most recent Mortgage that was taken out on this home.
Original Mortgage
$276,000
Interest Rate
5.87%
Mortgage Type
Purchase Money Mortgage
Purchase Details
Closed on
Apr 24, 2002
Sold by
Ward Dennis A and Ward Anna M
Bought by
Ward Dennis A and Ward Anna M
Purchase Details
Closed on
Mar 22, 2001
Sold by
Ward Dennis A and Ward Anna M
Bought by
Ward Dennis A and Ward Anna M
Home Financials for this Owner
Home Financials are based on the most recent Mortgage that was taken out on this home.
Original Mortgage
$275,000
Interest Rate
7.15%
Purchase Details
Closed on
Feb 5, 1999
Sold by
Ward Dennis A and Ward Anna M
Bought by
Ward Dennis A and Ward Anna M
Create a Home Valuation Report for This Property
The Home Valuation Report is an in-depth analysis detailing your home's value as well as a comparison with similar homes in the area
Home Values in the Area
Average Home Value in this Area
Purchase History
| Date | Buyer | Sale Price | Title Company |
|---|---|---|---|
| Ward Dennis A | -- | None Available | |
| Ward Dennis A | -- | Pacific Coast Title Company | |
| Ward Dennis A | -- | -- | |
| Ward Dennis A | -- | Chicago Title Co | |
| Ward Dennis A | -- | American Title Ins Co | |
| Ward Dennis A | -- | North American Title Co | |
| Ward Dennis A | -- | -- |
Source: Public Records
Mortgage History
| Date | Status | Borrower | Loan Amount |
|---|---|---|---|
| Closed | Ward Dennis A | $276,000 | |
| Closed | Ward Dennis A | $275,000 |
Source: Public Records
Tax History Compared to Growth
Tax History
| Year | Tax Paid | Tax Assessment Tax Assessment Total Assessment is a certain percentage of the fair market value that is determined by local assessors to be the total taxable value of land and additions on the property. | Land | Improvement |
|---|---|---|---|---|
| 2025 | $5,719 | $454,060 | $123,670 | $330,390 |
| 2024 | $5,719 | $445,157 | $121,245 | $323,912 |
| 2023 | $5,602 | $436,429 | $118,868 | $317,561 |
| 2022 | $5,513 | $427,872 | $116,537 | $311,335 |
| 2021 | $5,403 | $419,483 | $114,252 | $305,231 |
| 2020 | $5,284 | $415,182 | $113,080 | $302,102 |
| 2019 | $5,112 | $407,042 | $110,863 | $296,179 |
| 2018 | $5,038 | $399,061 | $108,689 | $290,372 |
| 2017 | $4,952 | $391,237 | $106,558 | $284,679 |
| 2016 | $4,853 | $383,566 | $104,468 | $279,098 |
| 2015 | $4,794 | $377,805 | $102,899 | $274,906 |
| 2014 | $4,647 | $370,405 | $100,884 | $269,521 |
Source: Public Records
Map
Nearby Homes
- 21290 Clear Haven Dr
- 3971 Hollow Ridge Ct
- 3862 Ravenswood Dr
- 4465 San Antonio Rd
- 3635 Banyon Rim Rd
- 4152 Beech Ave
- 21451 Cloud Ridge
- 4090 Naples Ct
- 3620 Sherwood Dr
- 4080 Naples Ct
- 20681 Via Amarilla
- Cielo Vista Plan at Cielo Vista
- Cielo Vista 4 Plan at Cielo Vista
- Cielo Vista 3 Plan at Cielo Vista
- 3610 Windsong Cir
- 21590 Via Pepita
- 0 Rim Rd Unit TR25058025
- 3695 Blue Gum Dr
- 20660 Calle Feliz
- 4418 Avenida Del Este
- 21180 Castlerock Rd
- 21145 Castlerock Rd
- 21125 Castlerock Rd
- 21160 Castlerock Rd
- 4035 San Antonio Rd
- 21140 Castlerock Rd
- 4005 San Antonio Rd
- 4015 San Antonio Rd
- 21105 Castlerock Rd
- 4025 San Antonio Rd
- 21120 Castlerock Rd
- 3995 San Antonio Rd
- 21135 Timber Ridge Rd
- 3985 San Antonio Rd
- 21085 Castlerock Rd
- 21155 Timber Ridge Rd
- 21100 Castlerock Rd
- 21115 Timber Ridge Rd
- 4045 San Antonio Rd
- 3975 San Antonio Rd