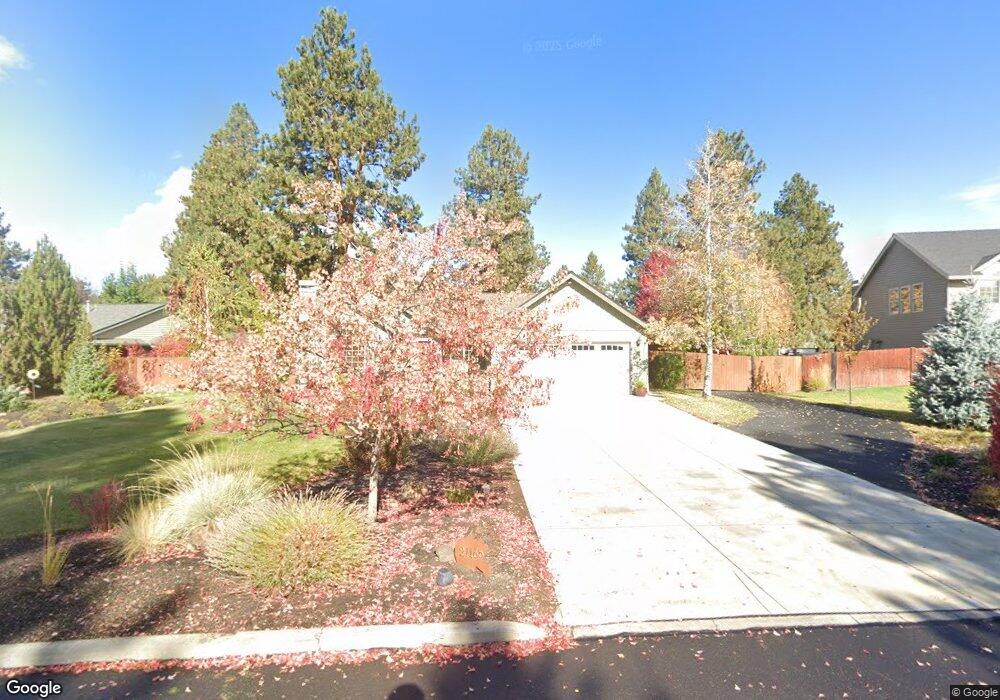
21166 Strawberry Mountain Ct Bend, OR 97702
Old Farm District NeighborhoodEstimated Value: $740,000 - $804,000
3
Beds
2
Baths
1,464
Sq Ft
$523/Sq Ft
Est. Value
About This Home
This home is located at 21166 Strawberry Mountain Ct, Bend, OR 97702 and is currently estimated at $766,214, approximately $523 per square foot. 21166 Strawberry Mountain Ct is a home located in Deschutes County with nearby schools including Silver Rail Elementary School, High Desert Middle School, and Bend Senior High School.
Ownership History
Date
Name
Owned For
Owner Type
Purchase Details
Closed on
Jul 19, 2010
Sold by
Givens Ernie J and Givens Judith E
Bought by
Givens Ernie J and Givens Judith E
Current Estimated Value
Purchase Details
Closed on
Feb 25, 2005
Sold by
Julian Joseph
Bought by
Givens Ernie J and Givens Judith E
Home Financials for this Owner
Home Financials are based on the most recent Mortgage that was taken out on this home.
Original Mortgage
$220,000
Outstanding Balance
$110,928
Interest Rate
5.73%
Mortgage Type
Unknown
Estimated Equity
$655,286
Purchase Details
Closed on
Jan 19, 2005
Sold by
Julian Vanessa Lynn
Bought by
Julian Joseph
Home Financials for this Owner
Home Financials are based on the most recent Mortgage that was taken out on this home.
Original Mortgage
$220,000
Outstanding Balance
$110,928
Interest Rate
5.73%
Mortgage Type
Unknown
Estimated Equity
$655,286
Create a Home Valuation Report for This Property
The Home Valuation Report is an in-depth analysis detailing your home's value as well as a comparison with similar homes in the area
Home Values in the Area
Average Home Value in this Area
Purchase History
| Date | Buyer | Sale Price | Title Company |
|---|---|---|---|
| Givens Ernie J | -- | None Available | |
| Givens Ernie J | $275,000 | Deschutes County Title Co | |
| Julian Joseph | -- | Deschutes County Title Co |
Source: Public Records
Mortgage History
| Date | Status | Borrower | Loan Amount |
|---|---|---|---|
| Open | Givens Ernie J | $220,000 |
Source: Public Records
Tax History Compared to Growth
Tax History
| Year | Tax Paid | Tax Assessment Tax Assessment Total Assessment is a certain percentage of the fair market value that is determined by local assessors to be the total taxable value of land and additions on the property. | Land | Improvement |
|---|---|---|---|---|
| 2025 | $5,647 | $334,190 | -- | -- |
| 2024 | $5,433 | $324,460 | -- | -- |
| 2023 | $5,036 | $315,010 | $0 | $0 |
| 2022 | $4,699 | $296,940 | $0 | $0 |
| 2021 | $4,706 | $288,300 | $0 | $0 |
| 2020 | $4,464 | $288,300 | $0 | $0 |
| 2019 | $4,340 | $279,910 | $0 | $0 |
| 2018 | $4,218 | $271,760 | $0 | $0 |
| 2017 | $4,094 | $263,850 | $0 | $0 |
| 2016 | $3,904 | $256,170 | $0 | $0 |
| 2015 | $3,796 | $248,710 | $0 | $0 |
| 2014 | $3,684 | $241,470 | $0 | $0 |
Source: Public Records
Map
Nearby Homes
- 61405 Steens Mountain Loop
- 61336 Mount Vista Dr
- 21425 SE Krakatoa Ct
- 21412 SE Krakatoa Ct Unit Lot 103
- 61445 SE 27th St Unit 86
- 61445 SE 27th St Unit 55
- 61445 SE 27th St Unit 48
- 61445 SE 27th St Unit 59
- 61445 SE 27th St Unit 100
- 21841 SE Stromboli Ct Unit Lot 96
- 21409 SE Krakatoa Ct
- 21428 SE Krakatoa Ct Unit Lot 99
- 21062 Desert Woods Dr
- 21844 SE Stromboli Ct
- 21525 SE Etna Place
- 21408 SE Krakatoa Ct
- 21648 SE Fuji Dr
- 21517 SE Etna Place
- 21704 SE Stromboli Ln
- 21720 SE Stromboli Ln
- 21176 Strawberry Mountain Ct
- 21170 Wilderness Way
- 21160 Wilderness Way
- 21186 Strawberry Mountain Ct
- 21180 Wilderness Way
- 21150 Wilderness Way
- 21195 Strawberry Mountain Ct
- 21196 Strawberry Mountain Ct
- 21165 Wilderness Way
- 21155 Wilderness Way
- 21175 Wilderness Way
- 21140 Wilderness Way
- 21185 Wilderness Way
- 21190 Wilderness Way
- 21145 Wilderness Way
- 61330 Steens Mountain Loop
- 61320 Steens Mountain Loop
- 61445 Steens Mountain Loop
- 61440 Steens Mountain Loop
- 21130 Wilderness Way