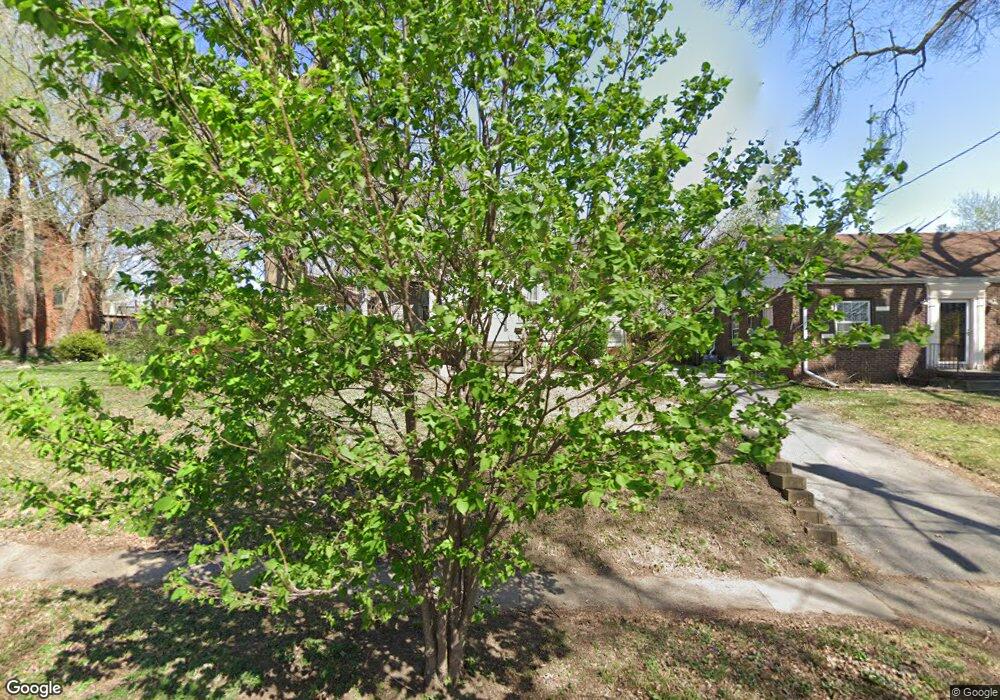
2117 39th St Des Moines, IA 50310
Beaverdale NeighborhoodEstimated Value: $203,000 - $215,000
2
Beds
1
Bath
798
Sq Ft
$265/Sq Ft
Est. Value
About This Home
This home is located at 2117 39th St, Des Moines, IA 50310 and is currently estimated at $211,198, approximately $264 per square foot. 2117 39th St is a home located in Polk County with nearby schools including Perkins Elementary School, Merrill Middle School, and Roosevelt High School.
Ownership History
Date
Name
Owned For
Owner Type
Purchase Details
Closed on
May 24, 2013
Sold by
Atkins Jerrad
Bought by
Atkin Jerrad and Atkin Ann
Current Estimated Value
Home Financials for this Owner
Home Financials are based on the most recent Mortgage that was taken out on this home.
Original Mortgage
$103,902
Outstanding Balance
$73,692
Interest Rate
3.5%
Mortgage Type
FHA
Estimated Equity
$137,506
Purchase Details
Closed on
May 18, 2009
Sold by
Atkin Lindsay
Bought by
Atkin Jerrad
Purchase Details
Closed on
Jun 2, 2006
Sold by
Schuman Allison M
Bought by
Atkins Jerrad and Atkins Lindsey
Home Financials for this Owner
Home Financials are based on the most recent Mortgage that was taken out on this home.
Original Mortgage
$113,998
Interest Rate
6.66%
Mortgage Type
FHA
Purchase Details
Closed on
May 3, 2004
Sold by
Farnsworth Joseph L and Farnsworth Cindy R
Bought by
Schuman Allison M
Create a Home Valuation Report for This Property
The Home Valuation Report is an in-depth analysis detailing your home's value as well as a comparison with similar homes in the area
Home Values in the Area
Average Home Value in this Area
Purchase History
| Date | Buyer | Sale Price | Title Company |
|---|---|---|---|
| Atkin Jerrad | -- | None Available | |
| Atkin Jerrad | -- | None Available | |
| Atkins Jerrad | $117,500 | None Available | |
| Schuman Allison M | $106,500 | -- |
Source: Public Records
Mortgage History
| Date | Status | Borrower | Loan Amount |
|---|---|---|---|
| Open | Atkin Jerrad | $103,902 | |
| Closed | Atkins Jerrad | $113,998 |
Source: Public Records
Tax History Compared to Growth
Tax History
| Year | Tax Paid | Tax Assessment Tax Assessment Total Assessment is a certain percentage of the fair market value that is determined by local assessors to be the total taxable value of land and additions on the property. | Land | Improvement |
|---|---|---|---|---|
| 2025 | $3,572 | $201,600 | $45,600 | $156,000 |
| 2024 | $3,572 | $181,600 | $41,000 | $140,600 |
| 2023 | $3,638 | $181,600 | $41,000 | $140,600 |
| 2022 | $3,612 | $154,400 | $36,200 | $118,200 |
| 2021 | $3,502 | $154,400 | $36,200 | $118,200 |
| 2020 | $3,638 | $140,300 | $33,100 | $107,200 |
| 2019 | $3,364 | $140,300 | $33,100 | $107,200 |
| 2018 | $3,330 | $125,200 | $29,500 | $95,700 |
| 2017 | $3,026 | $125,200 | $29,500 | $95,700 |
| 2016 | $2,948 | $111,900 | $25,800 | $86,100 |
| 2015 | $2,948 | $111,900 | $25,800 | $86,100 |
| 2014 | $2,854 | $107,400 | $24,500 | $82,900 |
Source: Public Records
Map
Nearby Homes