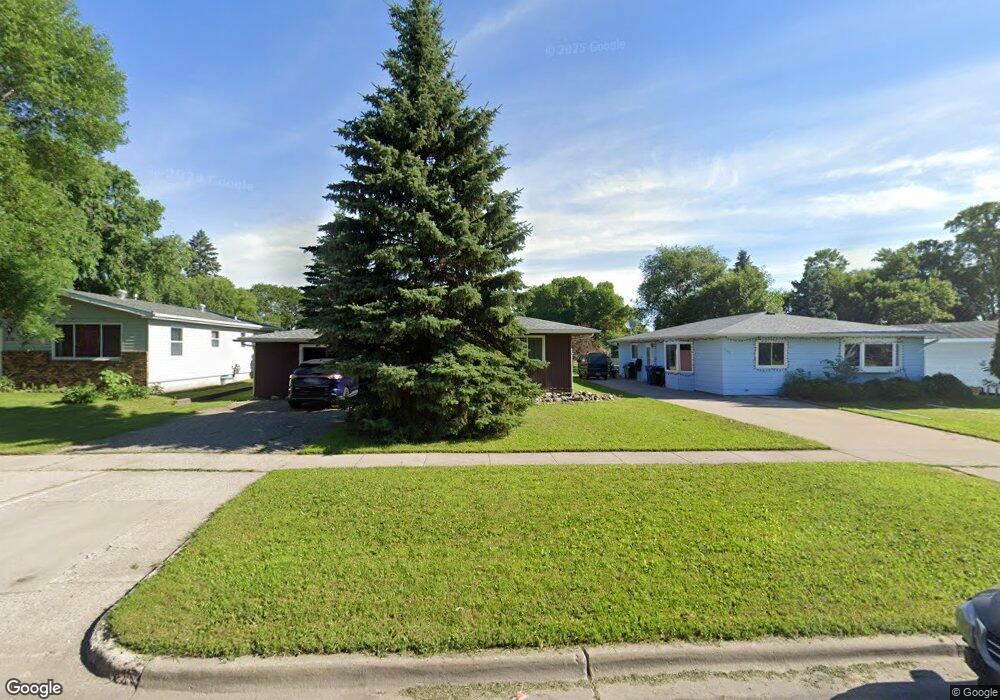
2117 6th Ave S Fargo, ND 58103
Jefferson-Carl NeighborhoodEstimated Value: $202,000 - $226,233
3
Beds
1
Bath
1,024
Sq Ft
$213/Sq Ft
Est. Value
About This Home
This home is located at 2117 6th Ave S, Fargo, ND 58103 and is currently estimated at $217,808, approximately $212 per square foot. 2117 6th Ave S is a home located in Cass County with nearby schools including Jefferson Elementary School, Carl Ben Eielson Middle School, and South High School.
Ownership History
Date
Name
Owned For
Owner Type
Purchase Details
Closed on
May 11, 2007
Sold by
Breker Phillip and Breker Lindsey
Bought by
Showalter James D and Showalter Sally A
Current Estimated Value
Home Financials for this Owner
Home Financials are based on the most recent Mortgage that was taken out on this home.
Original Mortgage
$109,900
Outstanding Balance
$71,386
Interest Rate
7.45%
Mortgage Type
Adjustable Rate Mortgage/ARM
Estimated Equity
$146,423
Purchase Details
Closed on
Apr 15, 2007
Sold by
Breker Phillip and Breker Lindsey
Bought by
Breker Phillip and Breker Lindsey
Home Financials for this Owner
Home Financials are based on the most recent Mortgage that was taken out on this home.
Original Mortgage
$109,900
Outstanding Balance
$71,386
Interest Rate
7.45%
Mortgage Type
Adjustable Rate Mortgage/ARM
Estimated Equity
$146,423
Create a Home Valuation Report for This Property
The Home Valuation Report is an in-depth analysis detailing your home's value as well as a comparison with similar homes in the area
Home Values in the Area
Average Home Value in this Area
Purchase History
| Date | Buyer | Sale Price | Title Company |
|---|---|---|---|
| Showalter James D | -- | -- | |
| Breker Phillip | -- | -- |
Source: Public Records
Mortgage History
| Date | Status | Borrower | Loan Amount |
|---|---|---|---|
| Open | Showalter James D | $109,900 |
Source: Public Records
Tax History Compared to Growth
Tax History
| Year | Tax Paid | Tax Assessment Tax Assessment Total Assessment is a certain percentage of the fair market value that is determined by local assessors to be the total taxable value of land and additions on the property. | Land | Improvement |
|---|---|---|---|---|
| 2024 | $2,406 | $95,500 | $19,050 | $76,450 |
| 2023 | $2,893 | $95,500 | $19,050 | $76,450 |
| 2022 | $2,869 | $92,700 | $19,050 | $73,650 |
| 2021 | $2,652 | $86,250 | $19,050 | $67,200 |
| 2020 | $2,644 | $86,250 | $19,050 | $67,200 |
| 2019 | $2,499 | $81,500 | $8,850 | $72,650 |
| 2018 | $2,469 | $81,500 | $8,850 | $72,650 |
| 2017 | $2,446 | $81,500 | $8,850 | $72,650 |
| 2016 | $2,184 | $79,150 | $8,850 | $70,300 |
| 2015 | $1,906 | $63,150 | $7,500 | $55,650 |
| 2014 | $1,869 | $60,150 | $7,500 | $52,650 |
| 2013 | $1,787 | $57,300 | $7,500 | $49,800 |
Source: Public Records
Map
Nearby Homes