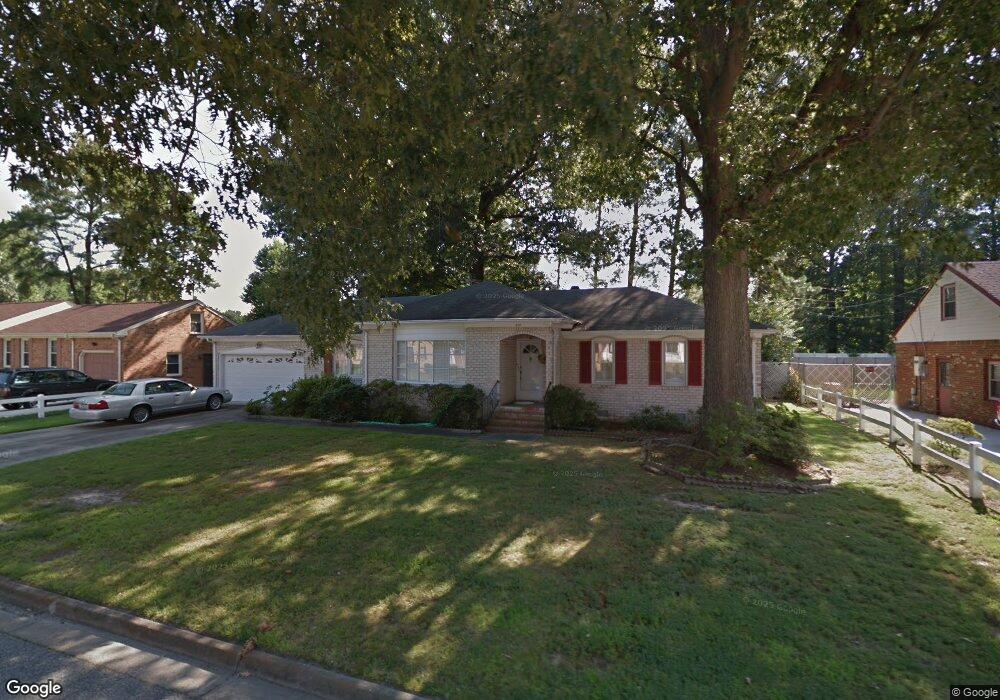
2117 Burnside Place Chesapeake, VA 23325
Indian River NeighborhoodEstimated Value: $378,000 - $452,000
3
Beds
2
Baths
2,038
Sq Ft
$199/Sq Ft
Est. Value
About This Home
This home is located at 2117 Burnside Place, Chesapeake, VA 23325 and is currently estimated at $406,399, approximately $199 per square foot. 2117 Burnside Place is a home located in Chesapeake City with nearby schools including Georgetown Primary School, Sparrow Road Intermediate School, and Indian River Middle.
Ownership History
Date
Name
Owned For
Owner Type
Purchase Details
Closed on
Aug 15, 2019
Sold by
The Estate Of John I Sawyer
Bought by
Moody Brett M and Moody Alyssa M
Current Estimated Value
Home Financials for this Owner
Home Financials are based on the most recent Mortgage that was taken out on this home.
Original Mortgage
$240,052
Outstanding Balance
$210,241
Interest Rate
3.7%
Mortgage Type
VA
Estimated Equity
$196,158
Create a Home Valuation Report for This Property
The Home Valuation Report is an in-depth analysis detailing your home's value as well as a comparison with similar homes in the area
Home Values in the Area
Average Home Value in this Area
Purchase History
| Date | Buyer | Sale Price | Title Company |
|---|---|---|---|
| Moody Brett M | $235,000 | Linear Title & Escrow |
Source: Public Records
Mortgage History
| Date | Status | Borrower | Loan Amount |
|---|---|---|---|
| Open | Moody Brett M | $240,052 |
Source: Public Records
Tax History Compared to Growth
Tax History
| Year | Tax Paid | Tax Assessment Tax Assessment Total Assessment is a certain percentage of the fair market value that is determined by local assessors to be the total taxable value of land and additions on the property. | Land | Improvement |
|---|---|---|---|---|
| 2025 | $3,195 | $343,600 | $125,000 | $218,600 |
| 2024 | $3,195 | $316,300 | $115,000 | $201,300 |
| 2023 | $2,820 | $294,700 | $105,000 | $189,700 |
| 2022 | $2,869 | $284,100 | $95,000 | $189,100 |
| 2021 | $2,565 | $244,300 | $75,000 | $169,300 |
| 2020 | $2,512 | $239,200 | $75,000 | $164,200 |
| 2019 | $2,469 | $235,600 | $75,000 | $160,600 |
| 2018 | $2,492 | $223,100 | $75,000 | $148,100 |
| 2017 | $2,412 | $229,700 | $75,000 | $154,700 |
| 2016 | $2,412 | $229,700 | $75,000 | $154,700 |
| 2015 | $2,412 | $229,700 | $75,000 | $154,700 |
| 2014 | $2,412 | $229,700 | $75,000 | $154,700 |
Source: Public Records
Map
Nearby Homes
- 200 Fillmore Place
- 2209 Georgetown Blvd
- 2130 Rock Creek Dr
- 2034 Allison Dr
- 41 King George Quay
- 2001 Candlelight Dr
- 66 King George Quay
- 1831 Hearthside Ct
- 224 Dexter St E
- 2701 Omar St
- 2308 Dunbarton Dr
- 2320 Dunbarton Ct
- 2144 Campostella Rd
- 2535 Dexter St E
- 1815 Elizabeth Ave
- 1832 Elizabeth Ave
- 517 Dent Place
- 2236 Vicker Ave
- 2924 Candlewood Cir
- 2218 Vicker Ave
- 2113 Burnside Place
- 2121 Burnside Place
- 2112 Quaker Place
- 2116 Burnside Place
- 2116 Quaker Place
- 2108 Quaker Place
- 2109 Burnside Place
- 2120 Burnside Place
- 2112 Burnside Place
- 2124 Burnside Place
- 2149 Lloyd Dr
- 2108 Burnside Place
- 2113 Quaker Place
- 2117 Quaker Place
- 2105 Burnside Place
- 2129 Allison Dr
- 2133 Allison Dr
- 2104 Quaker Place
- 2104 Burnside Place
- 2109 Quaker Place