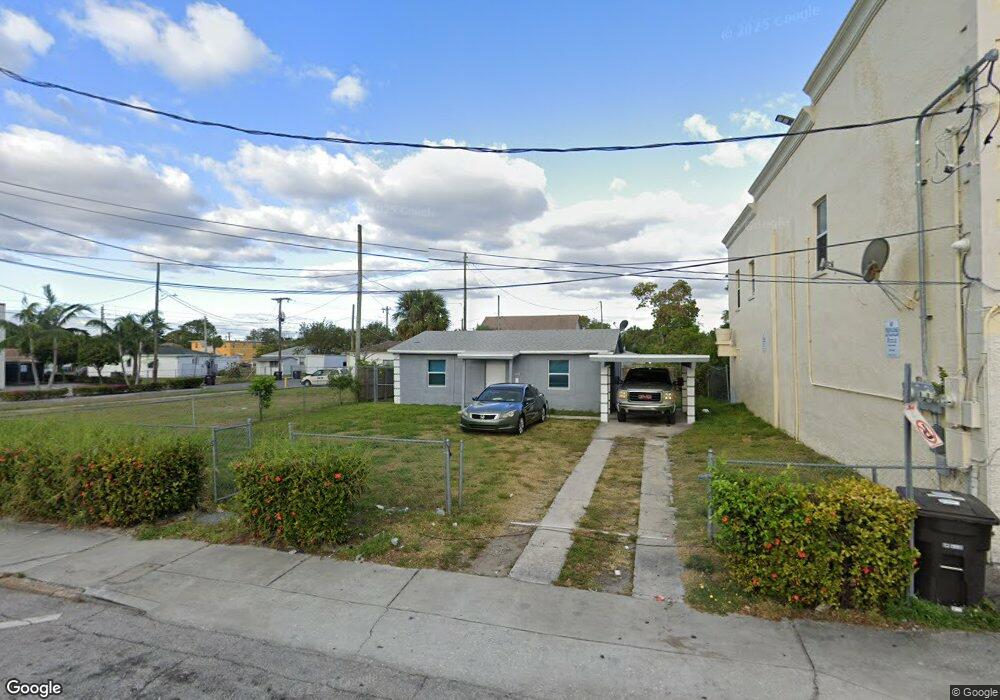
2117 N Tamarind Ave West Palm Beach, FL 33407
North Tamarind NeighborhoodEstimated Value: $223,000 - $275,000
2
Beds
2
Baths
1,024
Sq Ft
$239/Sq Ft
Est. Value
About This Home
This home is located at 2117 N Tamarind Ave, West Palm Beach, FL 33407 and is currently estimated at $244,777, approximately $239 per square foot. 2117 N Tamarind Ave is a home located in Palm Beach County with nearby schools including Pleasant City Elementary School, Palm Beach Lakes High School, and University Preparatory Academy Palm Beach.
Ownership History
Date
Name
Owned For
Owner Type
Purchase Details
Closed on
Oct 31, 2025
Sold by
Nasai Cheryl Bishop and 2117 N Tamarind Avenue Land Trust
Bought by
Coleman Park Iv Llc
Current Estimated Value
Purchase Details
Closed on
Dec 2, 2019
Sold by
Batniji Ahmed and Revocable Trust Dated December
Bought by
Nasal Cheryl Bishop and 2117 N Tamarind Ave Land Trust
Purchase Details
Closed on
Dec 13, 2018
Sold by
Batniji Ahmed
Bought by
Batniji Ahmed
Purchase Details
Closed on
Aug 15, 2005
Sold by
Buono Frances J and Buono Jamesetta T
Bought by
Batniji Ahmed S
Home Financials for this Owner
Home Financials are based on the most recent Mortgage that was taken out on this home.
Original Mortgage
$53,000
Interest Rate
5.61%
Mortgage Type
Stand Alone First
Purchase Details
Closed on
Jul 20, 1999
Sold by
Dilisio Charles E
Bought by
Buono Frances J
Home Financials for this Owner
Home Financials are based on the most recent Mortgage that was taken out on this home.
Original Mortgage
$48,000
Interest Rate
7.43%
Mortgage Type
New Conventional
Create a Home Valuation Report for This Property
The Home Valuation Report is an in-depth analysis detailing your home's value as well as a comparison with similar homes in the area
Home Values in the Area
Average Home Value in this Area
Purchase History
| Date | Buyer | Sale Price | Title Company |
|---|---|---|---|
| Coleman Park Iv Llc | $387,500 | None Listed On Document | |
| Nasal Cheryl Bishop | -- | Attorney | |
| Batniji Ahmed | -- | Attorney | |
| Batniji Ahmed S | $53,000 | Express Land Title Inc | |
| Buono Frances J | $60,000 | -- | |
| Dilisio Charles E | $26,000 | -- |
Source: Public Records
Mortgage History
| Date | Status | Borrower | Loan Amount |
|---|---|---|---|
| Previous Owner | Batniji Ahmed S | $53,000 | |
| Previous Owner | Dilisio Charles E | $48,000 |
Source: Public Records
Tax History Compared to Growth
Tax History
| Year | Tax Paid | Tax Assessment Tax Assessment Total Assessment is a certain percentage of the fair market value that is determined by local assessors to be the total taxable value of land and additions on the property. | Land | Improvement |
|---|---|---|---|---|
| 2024 | $3,191 | $129,044 | -- | -- |
| 2023 | $2,952 | $117,313 | $38,520 | $117,104 |
| 2022 | $2,656 | $106,648 | $0 | $0 |
| 2021 | $2,447 | $105,788 | $27,840 | $77,948 |
| 2020 | $2,209 | $88,139 | $14,352 | $73,787 |
| 2019 | $1,961 | $84,875 | $11,440 | $73,435 |
| 2018 | $1,753 | $82,896 | $10,008 | $72,888 |
| 2017 | $1,500 | $59,362 | $8,340 | $51,022 |
| 2016 | $1,564 | $61,037 | $0 | $0 |
| 2015 | $1,643 | $62,818 | $0 | $0 |
| 2014 | $1,712 | $60,807 | $0 | $0 |
Source: Public Records
Map
Nearby Homes
- 805 20th St Unit A,B,C
- 731 21st St Unit 1-2
- 817 Grant St
- 728 20th St
- 719 21st St
- 1108 State St
- 2205 A E Isaacs Ave
- 1012 18th St
- 536 18th St
- 522 18th St
- 504 18th St
- 432 21st St Unit 2
- 1004 14th St
- 1504 N Sapodilla Ave
- 3009 S Terrace Dr
- 3014 Greenwood Ave
- 445 Lilac Ct
- 913 14th St
- 822 30th Ct
- 706 13th St
- 2121 N Tamarind Ave
- 0 N Tamarind Unit R3311858
- 1006 Lincoln Rd
- 1011 21st St
- 1014 Lincoln Rd
- 1029 21st St
- 1017 21st St
- 1016 Lincoln Rd
- 2108 N Tamarind Ave
- 1024 21st St
- 1019 21st St
- 1019 21st St Unit 1015
- 1019 21st St Unit 1019
- 1019 21st St Unit 1013
- 1018 Lincoln Rd
- 1021 21st St
- 932 21st St
- 2160 N Tamarind Ave Unit 302
- 1017 Lincoln Rd
- 2212 N Tamarind Ave