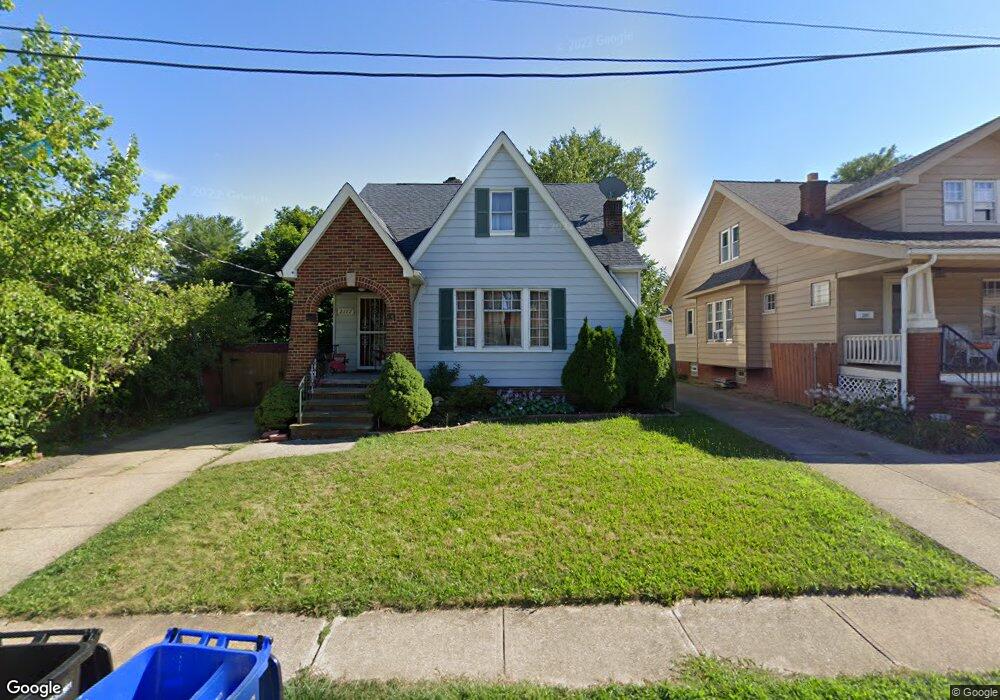
2117 Natchez Ave Cleveland, OH 44109
Old Brooklyn NeighborhoodEstimated Value: $106,000 - $177,000
2
Beds
1
Bath
910
Sq Ft
$152/Sq Ft
Est. Value
About This Home
This home is located at 2117 Natchez Ave, Cleveland, OH 44109 and is currently estimated at $138,588, approximately $152 per square foot. 2117 Natchez Ave is a home located in Cuyahoga County with nearby schools including Benjamin Franklin, Almira Academy, and Artemus Ward School.
Ownership History
Date
Name
Owned For
Owner Type
Purchase Details
Closed on
Nov 1, 2001
Sold by
Maurer Donna M and Gessley Donna
Bought by
Santiago Gloria E
Current Estimated Value
Home Financials for this Owner
Home Financials are based on the most recent Mortgage that was taken out on this home.
Original Mortgage
$98,455
Outstanding Balance
$38,708
Interest Rate
6.8%
Mortgage Type
FHA
Estimated Equity
$99,880
Purchase Details
Closed on
Jul 9, 1991
Sold by
Maurer Andrew M
Bought by
Maurer Donna M
Purchase Details
Closed on
Nov 26, 1986
Sold by
Hinkel Timothy J and Hinkel Elizabeth
Bought by
Maurer Andrew M
Purchase Details
Closed on
Sep 3, 1981
Sold by
Lamm William A
Bought by
Hinkel Timothy J and Hinkel Elizabeth
Purchase Details
Closed on
Sep 26, 1980
Sold by
Mann Henry D
Bought by
Lamm William A
Purchase Details
Closed on
Jun 7, 1978
Sold by
Schwenk Clara E
Bought by
Mann Henry D
Purchase Details
Closed on
Jan 1, 1975
Bought by
Schwenk Clara E
Create a Home Valuation Report for This Property
The Home Valuation Report is an in-depth analysis detailing your home's value as well as a comparison with similar homes in the area
Home Values in the Area
Average Home Value in this Area
Purchase History
| Date | Buyer | Sale Price | Title Company |
|---|---|---|---|
| Santiago Gloria E | $100,000 | Title Access Llc | |
| Maurer Donna M | -- | -- | |
| Maurer Andrew M | $46,000 | -- | |
| Hinkel Timothy J | $41,900 | -- | |
| Lamm William A | $34,000 | -- | |
| Mann Henry D | $20,000 | -- | |
| Schwenk Clara E | -- | -- |
Source: Public Records
Mortgage History
| Date | Status | Borrower | Loan Amount |
|---|---|---|---|
| Open | Santiago Gloria E | $98,455 |
Source: Public Records
Tax History Compared to Growth
Tax History
| Year | Tax Paid | Tax Assessment Tax Assessment Total Assessment is a certain percentage of the fair market value that is determined by local assessors to be the total taxable value of land and additions on the property. | Land | Improvement |
|---|---|---|---|---|
| 2024 | $2,430 | $37,065 | $7,175 | $29,890 |
| 2023 | $1,869 | $24,640 | $4,970 | $19,670 |
| 2022 | $1,858 | $24,640 | $4,970 | $19,670 |
| 2021 | $1,839 | $24,640 | $4,970 | $19,670 |
| 2020 | $1,650 | $19,110 | $3,850 | $15,260 |
| 2019 | $1,526 | $54,600 | $11,000 | $43,600 |
| 2018 | $1,546 | $19,110 | $3,850 | $15,260 |
| 2017 | $1,585 | $19,220 | $3,010 | $16,210 |
| 2016 | $1,573 | $19,220 | $3,010 | $16,210 |
| 2015 | $1,753 | $19,220 | $3,010 | $16,210 |
| 2014 | $1,753 | $21,350 | $3,360 | $17,990 |
Source: Public Records
Map
Nearby Homes
- 2219 Hood Ave
- 2018 Tampa Ave
- 2815 Tampa Ave
- 1917 Cypress Ave
- 2810 Natchez Ave
- 4491 W 30th St
- 2101 Broadview Rd
- 2312 Roanoke Ave Unit 1-2
- 4490 Broadale Rd
- 1825 Treadway Ave
- 1905 Creston Ave
- 4463 S Hills Dr
- 2802 Colburn Ave
- 4233 Valley Rd
- 4771 S Hills Dr
- 3404 Cypress Ave
- 3301 Hillcrest Ave
- 4267 W 21st St
- 4295 W 30th St
- 4302 W 30th St
- 2201 Natchez Ave
- 2205 Natchez Ave
- 4512 Broadview Rd
- 2108 Tampa Ave
- 2202 Tampa Ave
- 2209 Natchez Ave
- 2206 Tampa Ave
- 4518 Broadview Rd
- 4520 Broadview Rd
- 2208 Tampa Ave
- 2213 Natchez Ave
- 2116 Natchez Ave
- 4524 Broadview Rd
- 2200 Natchez Ave
- 2204 Natchez Ave
- 2210 Tampa Ave
- 2217 Natchez Ave
- 2208 Natchez Ave
- 2212 Tampa Ave
- 2212 Natchez Ave