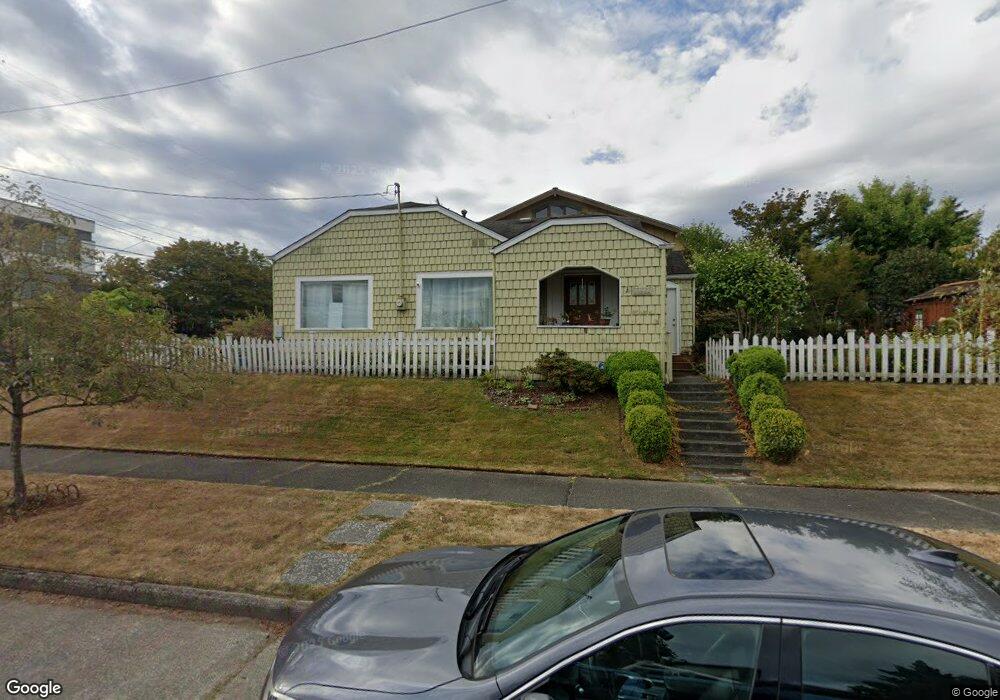
2117 S Lander St Seattle, WA 98144
North Beacon Hill NeighborhoodEstimated Value: $608,000 - $734,000
2
Beds
1
Bath
900
Sq Ft
$727/Sq Ft
Est. Value
About This Home
This home is located at 2117 S Lander St, Seattle, WA 98144 and is currently estimated at $654,607, approximately $727 per square foot. 2117 S Lander St is a home located in King County with nearby schools including Kimball Elementary School, Washington Middle School, and Franklin High School.
Ownership History
Date
Name
Owned For
Owner Type
Purchase Details
Closed on
Mar 18, 1999
Sold by
Leung Jane and Leung Marion
Bought by
Nguyen Hinh and Oshields Marshall Dean
Current Estimated Value
Home Financials for this Owner
Home Financials are based on the most recent Mortgage that was taken out on this home.
Original Mortgage
$132,000
Outstanding Balance
$31,892
Interest Rate
6.73%
Estimated Equity
$622,715
Purchase Details
Closed on
Jun 14, 1995
Sold by
Jeu Peter S
Bought by
Leung Jane and Leung Marion
Home Financials for this Owner
Home Financials are based on the most recent Mortgage that was taken out on this home.
Original Mortgage
$76,800
Interest Rate
8.37%
Purchase Details
Closed on
Apr 18, 1994
Sold by
Moore Jean E
Bought by
Jeu Peter S
Home Financials for this Owner
Home Financials are based on the most recent Mortgage that was taken out on this home.
Original Mortgage
$67,500
Interest Rate
6.37%
Create a Home Valuation Report for This Property
The Home Valuation Report is an in-depth analysis detailing your home's value as well as a comparison with similar homes in the area
Home Values in the Area
Average Home Value in this Area
Purchase History
| Date | Buyer | Sale Price | Title Company |
|---|---|---|---|
| Nguyen Hinh | $139,000 | Chicago Title | |
| Leung Jane | $96,000 | Commonwealth Land Title | |
| Jeu Peter S | $75,000 | -- |
Source: Public Records
Mortgage History
| Date | Status | Borrower | Loan Amount |
|---|---|---|---|
| Open | Nguyen Hinh | $132,000 | |
| Previous Owner | Leung Jane | $76,800 | |
| Previous Owner | Jeu Peter S | $67,500 |
Source: Public Records
Tax History Compared to Growth
Tax History
| Year | Tax Paid | Tax Assessment Tax Assessment Total Assessment is a certain percentage of the fair market value that is determined by local assessors to be the total taxable value of land and additions on the property. | Land | Improvement |
|---|---|---|---|---|
| 2024 | $5,345 | $517,000 | $327,000 | $190,000 |
| 2023 | $4,937 | $509,000 | $292,000 | $217,000 |
| 2022 | $4,766 | $545,000 | $250,000 | $295,000 |
| 2021 | $4,364 | $485,000 | $230,000 | $255,000 |
| 2020 | $4,271 | $419,000 | $196,000 | $223,000 |
| 2018 | $3,505 | $420,000 | $197,000 | $223,000 |
| 2017 | $3,014 | $328,000 | $174,000 | $154,000 |
| 2016 | $2,690 | $290,000 | $155,000 | $135,000 |
| 2015 | $2,497 | $252,000 | $135,000 | $117,000 |
| 2014 | -- | $240,000 | $139,000 | $101,000 |
| 2013 | -- | $226,000 | $124,000 | $102,000 |
Source: Public Records
Map
Nearby Homes
- 2601 23rd Ave S
- 2517 23rd Ave S
- 1910 S Lander St
- 2367 S Forest St
- 2817 19th Ave S
- 3100 23rd Ave S
- 1723 S Forest St
- 3061 20th Ave S
- 2305 24th Ave S
- 2307 Rainier Ave S
- 1748 S Hanford St
- 2225 25th Ave S
- 2109 S Horton St
- 2219 25th Ave S
- 2435 S Walker St
- 2705 S Winthrop St
- 2341 16th Ave S Unit C
- 2339 16th Ave S Unit A
- 2337 16th Ave S Unit C
- 3321 25th Ave S
- 2705 22nd Ave S
- 2709 22nd Ave S
- 2702 21st Ave S
- 2621 22nd Ave S
- 2706 21st Ave S
- 2715 22nd Ave S
- 2710 21st Ave S
- 2104 S Lander St
- 2700 22nd Ave S
- 2704 22nd Ave S
- 2712 21st Ave S
- 2616 21st Ave S
- 2615 22nd Ave S
- 2116 S Mcclellan St
- 2108 S Mcclellan St
- 2618 22nd Ave S
- 2716 21st Ave S
- 2718 22nd Ave S
- 2612 21st Ave S