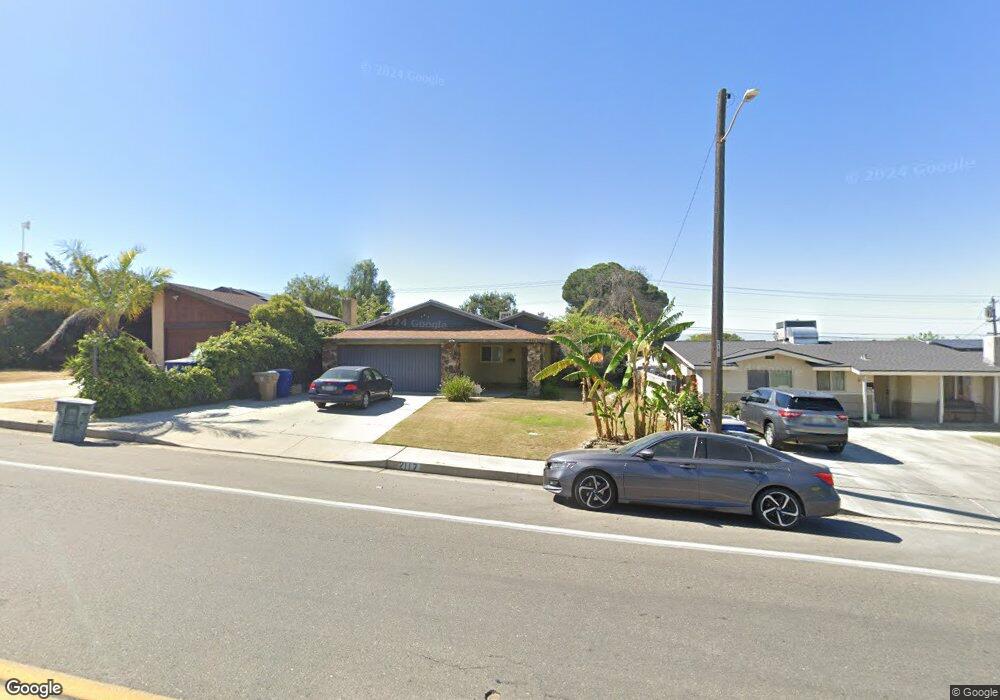
2117 University Ave Bakersfield, CA 93305
College Heights NeighborhoodEstimated Value: $326,000 - $356,000
3
Beds
2
Baths
1,582
Sq Ft
$216/Sq Ft
Est. Value
About This Home
This home is located at 2117 University Ave, Bakersfield, CA 93305 and is currently estimated at $342,476, approximately $216 per square foot. 2117 University Ave is a home located in Kern County with nearby schools including Colonel Howard Nichols Elementary School, Chipman Junior High School, and East Bakersfield High School.
Ownership History
Date
Name
Owned For
Owner Type
Purchase Details
Closed on
Mar 24, 2004
Sold by
Luevano Albert M and Luevano Juanita
Bought by
Antolik Matthew
Current Estimated Value
Home Financials for this Owner
Home Financials are based on the most recent Mortgage that was taken out on this home.
Original Mortgage
$140,800
Outstanding Balance
$64,326
Interest Rate
5.35%
Mortgage Type
Purchase Money Mortgage
Estimated Equity
$278,150
Purchase Details
Closed on
Apr 19, 2001
Sold by
Parra Daniel
Bought by
Parra Isabel
Purchase Details
Closed on
Apr 18, 2001
Sold by
Medrano Alma H and Rios Francisco
Bought by
Parra Isabel
Purchase Details
Closed on
Jul 22, 1998
Sold by
Alva Manuel V and Alva Alice
Bought by
Rios Francisco Javier and Medrano Alma Hortencia
Purchase Details
Closed on
Jul 1, 1998
Sold by
Rodriquez Cecelia
Bought by
Aha Manuel V and Aha Alice
Purchase Details
Closed on
Jan 14, 1998
Sold by
Lehr Living Tr and Harland E
Bought by
Madera Vincent and Rodriguez Cecilia
Create a Home Valuation Report for This Property
The Home Valuation Report is an in-depth analysis detailing your home's value as well as a comparison with similar homes in the area
Home Values in the Area
Average Home Value in this Area
Purchase History
| Date | Buyer | Sale Price | Title Company |
|---|---|---|---|
| Antolik Matthew | $177,500 | Ticor Title | |
| Parra Isabel | -- | -- | |
| Parra Isabel | -- | -- | |
| Rios Francisco Javier | -- | -- | |
| Aha Manuel V | -- | -- | |
| Rodriguez Cecelia | -- | -- | |
| Madera Vincent | $16,000 | Fidelity National Title Co |
Source: Public Records
Mortgage History
| Date | Status | Borrower | Loan Amount |
|---|---|---|---|
| Open | Antolik Matthew | $140,800 | |
| Closed | Antolik Matthew | $35,200 |
Source: Public Records
Tax History Compared to Growth
Tax History
| Year | Tax Paid | Tax Assessment Tax Assessment Total Assessment is a certain percentage of the fair market value that is determined by local assessors to be the total taxable value of land and additions on the property. | Land | Improvement |
|---|---|---|---|---|
| 2025 | $3,618 | $252,348 | $42,642 | $209,706 |
| 2024 | $3,544 | $247,401 | $41,806 | $205,595 |
| 2023 | $3,544 | $242,551 | $40,987 | $201,564 |
| 2022 | $3,469 | $237,796 | $40,184 | $197,612 |
| 2021 | $3,349 | $233,135 | $39,397 | $193,738 |
| 2020 | $3,311 | $230,746 | $38,994 | $191,752 |
| 2019 | $3,246 | $230,746 | $38,994 | $191,752 |
| 2018 | $3,170 | $221,788 | $37,481 | $184,307 |
| 2017 | $3,154 | $217,441 | $36,747 | $180,694 |
| 2016 | $2,879 | $213,178 | $36,027 | $177,151 |
| 2015 | $2,866 | $209,977 | $35,486 | $174,491 |
| 2014 | $2,629 | $193,000 | $48,000 | $145,000 |
Source: Public Records
Map
Nearby Homes
- 2109 University Ave
- 3112 Saint Marys St
- 3113 Occidental St
- 3516 Dana St Unit 3
- 3516 Dana St Unit 10
- 3901 Noel Place
- 2600 Driller Ave
- 2700 University Ave
- 2701 Kaibab Ave
- 2905 Arnold St
- 1605 Duke Dr
- 1513 University Ave
- 2825 Arnold St
- 2801 Kaibab Ave
- 1416 Duke Dr
- 3613 Fleetwood Way
- 2818 San Pablo Ave
- 2904 Cornell St
- 1312 Shattuck Ave
- 3706 Rampart St