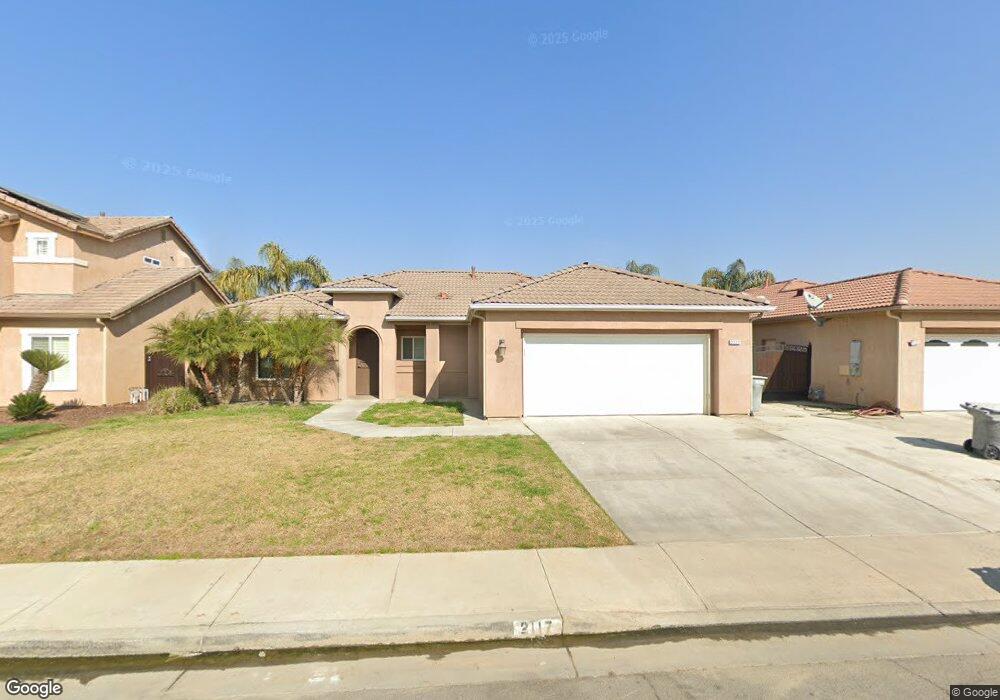
2117 Via Calabria Ave Delano, CA 93215
East Delano NeighborhoodEstimated Value: $392,441 - $443,000
4
Beds
2
Baths
1,661
Sq Ft
$257/Sq Ft
Est. Value
About This Home
This home is located at 2117 Via Calabria Ave, Delano, CA 93215 and is currently estimated at $427,360, approximately $257 per square foot. 2117 Via Calabria Ave is a home located in Kern County with nearby schools including Harvest Elementary School, La Vina Middle School, and Cesar E. Chavez High School.
Ownership History
Date
Name
Owned For
Owner Type
Purchase Details
Closed on
Jun 20, 2023
Sold by
Kern County Home Rentals Llc
Bought by
Nunez Hector
Current Estimated Value
Purchase Details
Closed on
May 22, 2019
Sold by
Nunez Hector
Bought by
Kern County Home Rentals Llc
Purchase Details
Closed on
Nov 4, 2010
Sold by
Singh Gurjit
Bought by
Nunez Hector
Home Financials for this Owner
Home Financials are based on the most recent Mortgage that was taken out on this home.
Original Mortgage
$187,475
Interest Rate
4.23%
Mortgage Type
FHA
Purchase Details
Closed on
Aug 12, 2004
Sold by
Workman Bros Development Co
Bought by
Singh Gurjit
Home Financials for this Owner
Home Financials are based on the most recent Mortgage that was taken out on this home.
Original Mortgage
$178,800
Interest Rate
5.5%
Mortgage Type
New Conventional
Create a Home Valuation Report for This Property
The Home Valuation Report is an in-depth analysis detailing your home's value as well as a comparison with similar homes in the area
Home Values in the Area
Average Home Value in this Area
Purchase History
| Date | Buyer | Sale Price | Title Company |
|---|---|---|---|
| Nunez Hector | -- | None Listed On Document | |
| Kern County Home Rentals Llc | -- | None Available | |
| Nunez Hector | $190,000 | Placer Title Company | |
| Singh Gurjit | -- | First American Title |
Source: Public Records
Mortgage History
| Date | Status | Borrower | Loan Amount |
|---|---|---|---|
| Previous Owner | Nunez Hector | $187,475 | |
| Previous Owner | Singh Gurjit | $178,800 |
Source: Public Records
Tax History Compared to Growth
Tax History
| Year | Tax Paid | Tax Assessment Tax Assessment Total Assessment is a certain percentage of the fair market value that is determined by local assessors to be the total taxable value of land and additions on the property. | Land | Improvement |
|---|---|---|---|---|
| 2025 | $4,232 | $363,099 | $83,232 | $279,867 |
| 2024 | $3,176 | $355,980 | $81,600 | $274,380 |
| 2023 | $3,176 | $263,759 | $64,331 | $199,428 |
| 2022 | $3,130 | $258,588 | $63,070 | $195,518 |
| 2021 | $3,046 | $253,519 | $61,834 | $191,685 |
| 2020 | $3,060 | $250,920 | $61,200 | $189,720 |
| 2019 | $2,687 | $222,572 | $46,855 | $175,717 |
| 2018 | $2,652 | $213,932 | $45,037 | $168,895 |
| 2017 | $2,670 | $209,738 | $44,154 | $165,584 |
| 2016 | $2,627 | $205,627 | $43,289 | $162,338 |
| 2015 | $2,393 | $177,000 | $44,000 | $133,000 |
| 2014 | $2,242 | $174,000 | $44,000 | $130,000 |
Source: Public Records
Map
Nearby Homes
- 2225 Via Calabria Ave
- 1612 Xenia Ct
- 0 Cecil Ave
- 631 Union St
- 621 Union St
- 1201 Quincy St
- 1901 6th Ave
- 1741 Vassar St
- 1736 17th Ave
- 1732 17th Ave
- 1725 17th Place
- 2203 19th Ave
- 1911 Sierra Vista Dr
- 1518 9th Ave
- 1510 14th Ave
- 1941 Vassar St
- 800 Lexington St Unit 27
- 800 Lexington St Unit 3
- 800 Lexington St Unit 28
- 2121 Via Calabria Ave
- 2113 Via Calabria Ave
- 2118 Via Basilica Ave
- 2109 Via Calabria Ave
- 2125 Via Calabria Ave
- 2122 Via Basilica Ave
- 2114 Via Basilica Ave
- 2116 Via Calabria Ave
- 2110 Via Basilica Ave
- 2126 Via Basilica Ave
- 2120 Via Calabria Ave
- 2112 Via Calabria Ave
- 2129 Via Calabria Ave
- 2105 Via Calabria Ave
- 2124 Via Calabria Ave
- 2108 Via Calabria Ave
- 2106 Via Basilica Ave
- 2130 Via Basilica Ave
- 2128 Via Calabria Ave
- 2201 Via Calabria Ave