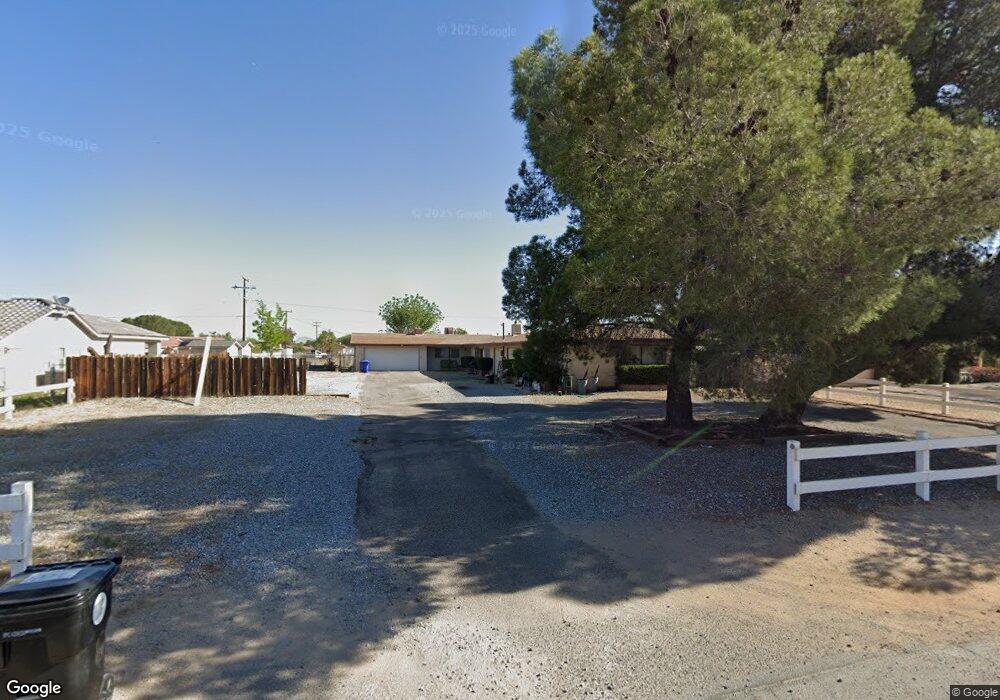
21170 Multnomah Rd Apple Valley, CA 92308
High Desert NeighborhoodEstimated Value: $426,000 - $493,000
3
Beds
3
Baths
1,982
Sq Ft
$229/Sq Ft
Est. Value
About This Home
This home is located at 21170 Multnomah Rd, Apple Valley, CA 92308 and is currently estimated at $453,333, approximately $228 per square foot. 21170 Multnomah Rd is a home located in San Bernardino County with nearby schools including Yucca Loma Elementary School and Apple Valley High School.
Ownership History
Date
Name
Owned For
Owner Type
Purchase Details
Closed on
Dec 15, 2004
Sold by
Sj Desert Properties Llc
Bought by
Hope Greg
Current Estimated Value
Home Financials for this Owner
Home Financials are based on the most recent Mortgage that was taken out on this home.
Original Mortgage
$196,300
Outstanding Balance
$98,045
Interest Rate
5.69%
Mortgage Type
Purchase Money Mortgage
Estimated Equity
$355,288
Purchase Details
Closed on
Jan 28, 2004
Sold by
Hope Greg
Bought by
Sj Desert Properties Llc
Purchase Details
Closed on
Feb 19, 2002
Sold by
Almy Donald G
Bought by
Hope Greg
Home Financials for this Owner
Home Financials are based on the most recent Mortgage that was taken out on this home.
Original Mortgage
$65,000
Interest Rate
6.87%
Purchase Details
Closed on
Nov 10, 1997
Sold by
Almy Donald G and Almy Louise S
Bought by
Almy Donald G and Almy Louise S
Create a Home Valuation Report for This Property
The Home Valuation Report is an in-depth analysis detailing your home's value as well as a comparison with similar homes in the area
Home Values in the Area
Average Home Value in this Area
Purchase History
| Date | Buyer | Sale Price | Title Company |
|---|---|---|---|
| Hope Greg | -- | First American | |
| Sj Desert Properties Llc | -- | -- | |
| Hope Greg | $90,000 | First American Title Ins Co | |
| Almy Donald G | -- | -- |
Source: Public Records
Mortgage History
| Date | Status | Borrower | Loan Amount |
|---|---|---|---|
| Open | Hope Greg | $196,300 | |
| Previous Owner | Hope Greg | $65,000 |
Source: Public Records
Tax History Compared to Growth
Tax History
| Year | Tax Paid | Tax Assessment Tax Assessment Total Assessment is a certain percentage of the fair market value that is determined by local assessors to be the total taxable value of land and additions on the property. | Land | Improvement |
|---|---|---|---|---|
| 2025 | $1,875 | $132,959 | $14,774 | $118,185 |
| 2024 | $1,875 | $130,352 | $14,484 | $115,868 |
| 2023 | $1,855 | $127,796 | $14,200 | $113,596 |
| 2022 | $1,825 | $125,291 | $13,922 | $111,369 |
| 2021 | $1,785 | $122,834 | $13,649 | $109,185 |
| 2020 | $1,761 | $121,574 | $13,509 | $108,065 |
| 2019 | $1,728 | $119,190 | $13,244 | $105,946 |
| 2018 | $1,687 | $116,853 | $12,984 | $103,869 |
| 2017 | $1,662 | $114,561 | $12,729 | $101,832 |
| 2016 | $1,461 | $112,314 | $12,479 | $99,835 |
| 2015 | -- | $110,627 | $12,292 | $98,335 |
| 2014 | $1,418 | $108,460 | $12,051 | $96,409 |
Source: Public Records
Map
Nearby Homes
- 21133 Multnomah Rd
- 21109 Sioux Rd
- 21215 Multnomah Rd
- 21275 Pocomoke Ct
- 21133 Pahute Rd
- 12421 Lakota Rd
- 12520 Tamiani Rd
- 21194 Laguna Rd
- 12397 Kiowa Rd
- 21255 Minnetonka Rd
- 12625 Tamiani Rd
- 21101 Sitkan Rd
- 21650 Bear Valley Rd
- 21512 Pahute Rd
- 11995 Jamacha Rd
- 11911 Kiowa Rd
- 21018 Little Beaver Rd
- 12765 Pocomoke Rd
- 12770 Lakota Rd
- 12650 Running Deer Rd
- 21180 Multnomah Rd
- 12322 Omak Rd
- 21190 Multnomah Rd
- 21134 Multnomah Rd Unit 3
- 21189 Sioux Rd
- 21150 Multnomah Rd
- 12327 Tamiani Rd
- 21169 Multnomah Rd
- 21123 Sioux Rd
- 21179 Multnomah Rd
- 21145 Multnomah Rd
- 21210 Multnomah Rd Unit d
- 21210 Multnomah Rd
- 21110 Multnomah Rd
- 12334 Omak Rd
- 21265 Sioux Rd
- 21187 Multnomah Rd
- 12337 Tamiani Rd
- 21212 Multnomah Rd Unit B
- 21212 Multnomah Rd