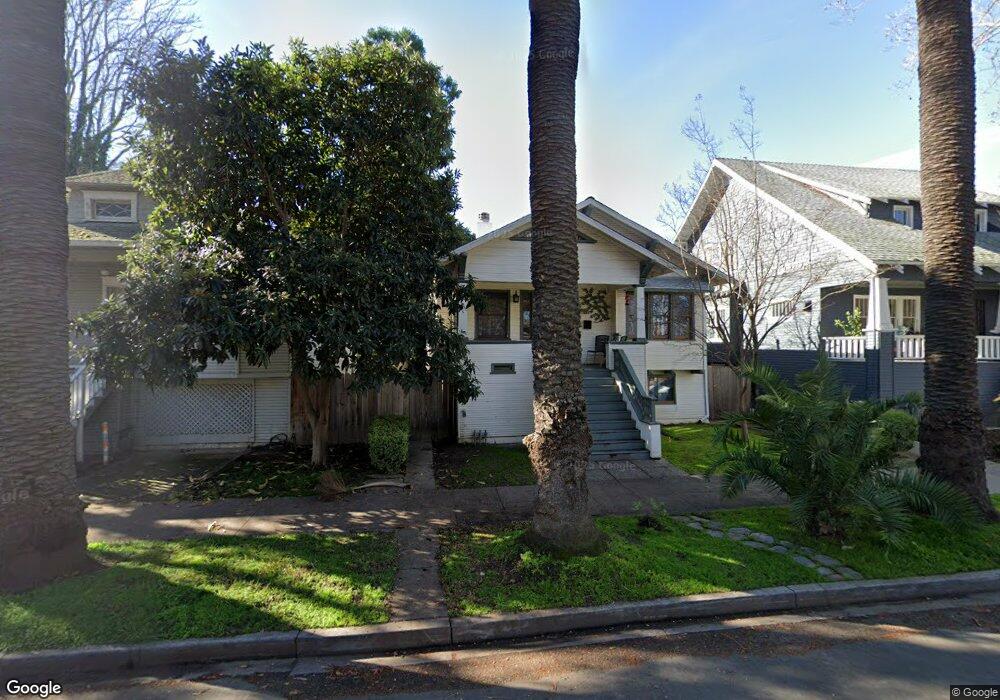
2118 C St Sacramento, CA 95816
New Era Park NeighborhoodEstimated Value: $668,000 - $1,057,000
4
Beds
2
Baths
1,822
Sq Ft
$463/Sq Ft
Est. Value
About This Home
This home is located at 2118 C St, Sacramento, CA 95816 and is currently estimated at $843,389, approximately $462 per square foot. 2118 C St is a home located in Sacramento County with nearby schools including Washington Elementary, Miwok Middle School, and C. K. McClatchy High.
Ownership History
Date
Name
Owned For
Owner Type
Purchase Details
Closed on
Sep 25, 2003
Sold by
Haak Lucas
Bought by
Haak Lucas
Current Estimated Value
Home Financials for this Owner
Home Financials are based on the most recent Mortgage that was taken out on this home.
Original Mortgage
$307,000
Interest Rate
6.22%
Mortgage Type
Balloon
Purchase Details
Closed on
Jul 1, 2002
Sold by
Plascencia Silbia and Plascencia Donaciano
Bought by
Haak Lucas
Home Financials for this Owner
Home Financials are based on the most recent Mortgage that was taken out on this home.
Original Mortgage
$272,000
Interest Rate
6.71%
Create a Home Valuation Report for This Property
The Home Valuation Report is an in-depth analysis detailing your home's value as well as a comparison with similar homes in the area
Home Values in the Area
Average Home Value in this Area
Purchase History
| Date | Buyer | Sale Price | Title Company |
|---|---|---|---|
| Haak Lucas | -- | Stewart Title | |
| Haak Lucas | $340,000 | Fidelity National Title Co |
Source: Public Records
Mortgage History
| Date | Status | Borrower | Loan Amount |
|---|---|---|---|
| Closed | Haak Lucas | $307,000 | |
| Closed | Haak Lucas | $272,000 | |
| Closed | Haak Lucas | $34,000 |
Source: Public Records
Tax History
| Year | Tax Paid | Tax Assessment Tax Assessment Total Assessment is a certain percentage of the fair market value that is determined by local assessors to be the total taxable value of land and additions on the property. | Land | Improvement |
|---|---|---|---|---|
| 2025 | $5,906 | $492,409 | $108,613 | $383,796 |
| 2024 | $5,906 | $482,755 | $106,484 | $376,271 |
| 2023 | $5,768 | $473,291 | $104,397 | $368,894 |
| 2022 | $5,671 | $464,011 | $102,350 | $361,661 |
| 2021 | $5,405 | $454,914 | $100,344 | $354,570 |
| 2020 | $5,448 | $450,251 | $99,316 | $350,935 |
| 2019 | $5,334 | $441,423 | $97,369 | $344,054 |
| 2018 | $5,196 | $432,768 | $95,460 | $337,308 |
| 2017 | $5,125 | $424,284 | $93,589 | $330,695 |
| 2016 | $5,032 | $415,965 | $91,754 | $324,211 |
| 2015 | $4,925 | $409,718 | $90,376 | $319,342 |
| 2014 | $4,793 | $401,693 | $88,606 | $313,087 |
Source: Public Records
Map
Nearby Homes
Your Personal Tour Guide
Ask me questions while you tour the home.