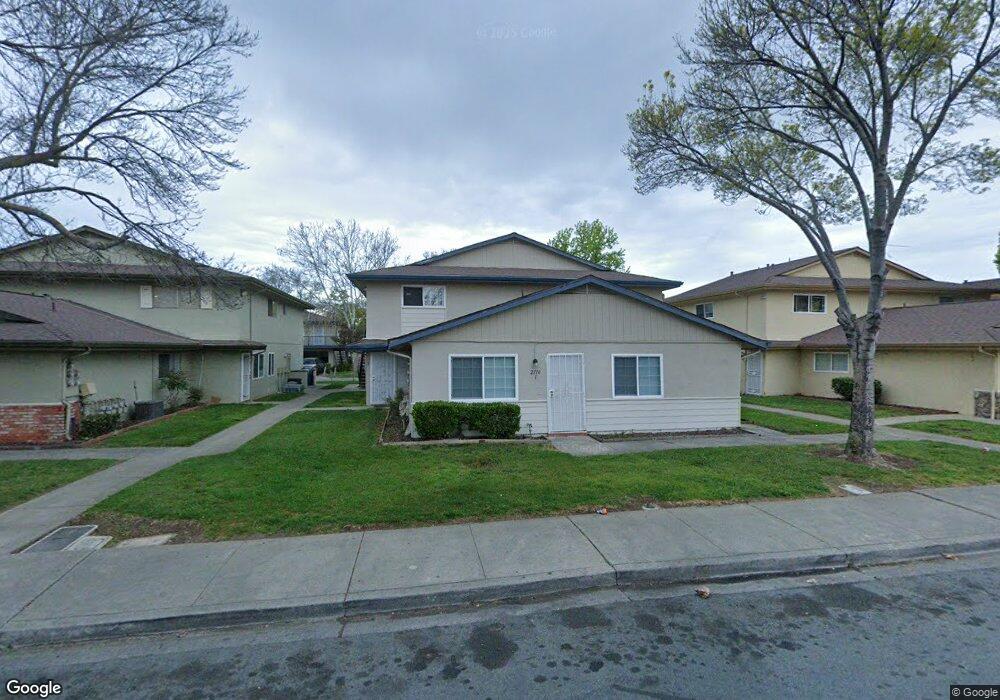
2118 Peppertree Way Unit 2 Antioch, CA 94509
North Antioch NeighborhoodEstimated Value: $171,603 - $182,000
2
Beds
1
Bath
903
Sq Ft
$197/Sq Ft
Est. Value
About This Home
This home is located at 2118 Peppertree Way Unit 2, Antioch, CA 94509 and is currently estimated at $177,534, approximately $196 per square foot. 2118 Peppertree Way Unit 2 is a home located in Contra Costa County with nearby schools including Marsh Elementary School, Park Middle School, and Antioch High School.
Ownership History
Date
Name
Owned For
Owner Type
Purchase Details
Closed on
Dec 8, 2016
Sold by
Z Unlimited Investments Llc
Bought by
Kumar Puneet and Vasudev Prithvi
Current Estimated Value
Purchase Details
Closed on
May 26, 2015
Sold by
Ng Gim Tim and Ng Xun Ling
Bought by
Z Unlimited Investments
Purchase Details
Closed on
Aug 19, 2010
Sold by
Federal National Mrotgage Association
Bought by
Ng Gin Tim and Ng Xun Ling
Purchase Details
Closed on
Jun 4, 2010
Sold by
Haynes Ralph and Haynes Rhonda N
Bought by
Federal National Mortgage Association
Purchase Details
Closed on
Jun 12, 2006
Sold by
Haynes Ralph and Haynes Rhonda N
Bought by
Haynes Ralph and Haynes Rhonda N
Purchase Details
Closed on
Jun 29, 1995
Sold by
Simpson Rose Marie and Kofflert Robert R
Bought by
Kofflert Robert R and Kofflert Frances M
Create a Home Valuation Report for This Property
The Home Valuation Report is an in-depth analysis detailing your home's value as well as a comparison with similar homes in the area
Home Values in the Area
Average Home Value in this Area
Purchase History
| Date | Buyer | Sale Price | Title Company |
|---|---|---|---|
| Kumar Puneet | $115,000 | Old Republic Title Company | |
| Z Unlimited Investments | $83,000 | Placer Title Company | |
| Ng Gin Tim | $40,000 | Stewart Title Of California | |
| Federal National Mortgage Association | $83,499 | Accommodation | |
| Haynes Ralph | -- | None Available | |
| Kofflert Robert R | $36,771 | American Title Co | |
| Kofflert Robert R | $36,771 | American Title Ins Co |
Source: Public Records
Tax History Compared to Growth
Tax History
| Year | Tax Paid | Tax Assessment Tax Assessment Total Assessment is a certain percentage of the fair market value that is determined by local assessors to be the total taxable value of land and additions on the property. | Land | Improvement |
|---|---|---|---|---|
| 2025 | $1,992 | $133,461 | $46,420 | $87,041 |
| 2024 | $1,933 | $130,845 | $45,510 | $85,335 |
| 2023 | $1,933 | $128,280 | $44,618 | $83,662 |
| 2022 | $1,909 | $125,766 | $43,744 | $82,022 |
| 2021 | $1,834 | $123,301 | $42,887 | $80,414 |
| 2019 | $1,791 | $119,646 | $41,616 | $78,030 |
| 2018 | $1,727 | $117,300 | $40,800 | $76,500 |
| 2017 | $1,678 | $115,000 | $40,000 | $75,000 |
| 2016 | $1,309 | $84,265 | $24,366 | $59,899 |
| 2015 | $832 | $42,637 | $12,790 | $29,847 |
| 2014 | $800 | $41,803 | $12,540 | $29,263 |
Source: Public Records
Map
Nearby Homes
- 2205 Lemontree Way Unit 3
- 2304 Peppertree Way Unit 4
- 2118 Peppertree Way Unit 4
- 2404 Lemontree Ct Unit 1
- 2104 Lemontree Way Unit 1
- 2101 Lemontree Way Unit 3
- 2404 Peppertree Ct Unit 1
- 2101 L St
- 2410 Sunny Ln Unit 26
- 1707 Magnolia Way
- 1713 Magnolia Way
- 1707 Mahogany Way Unit 63
- 2416 Shadow Ln Unit 74
- 1412 Buchanan Rd
- 2788 Entrada Cir
- 1746 San Jose Dr
- 1017 W 14th St
- 2400 Horizon Ln Unit 136
- 540 W Madill St
- 1016 San Carlos Dr
- 2118 Peppertree Way Unit 3
- 2122 Peppertree Way
- 2122 Peppertree Way Unit 4
- 2122 Peppertree Way Unit 3
- 2122 Peppertree Way Unit 2
- 2122 Peppertree Way Unit 1
- 2122 Peppertree Way #4
- 2114 Peppertree Way Unit 1
- 2114 Peppertree Way Unit 4
- 2114 Peppertree Way Unit 2
- 2200 Peppertree Way Unit 4
- 2200 Peppertree Way Unit 3
- 2200 Peppertree Way Unit 2
- 2200 Peppertree Way Unit 1
- 2121 Lemontree Way
- 2121 Lemontree Way Unit 1
- 2121 Lemontree Way Unit 4
- 2121 Lemontree Way Unit 3
- 2121 Lemontree Way Unit 2
- 2110 Peppertree Way