Estimated Value: $295,000 - $346,000
2
Beds
2
Baths
2,136
Sq Ft
$151/Sq Ft
Est. Value
About This Home
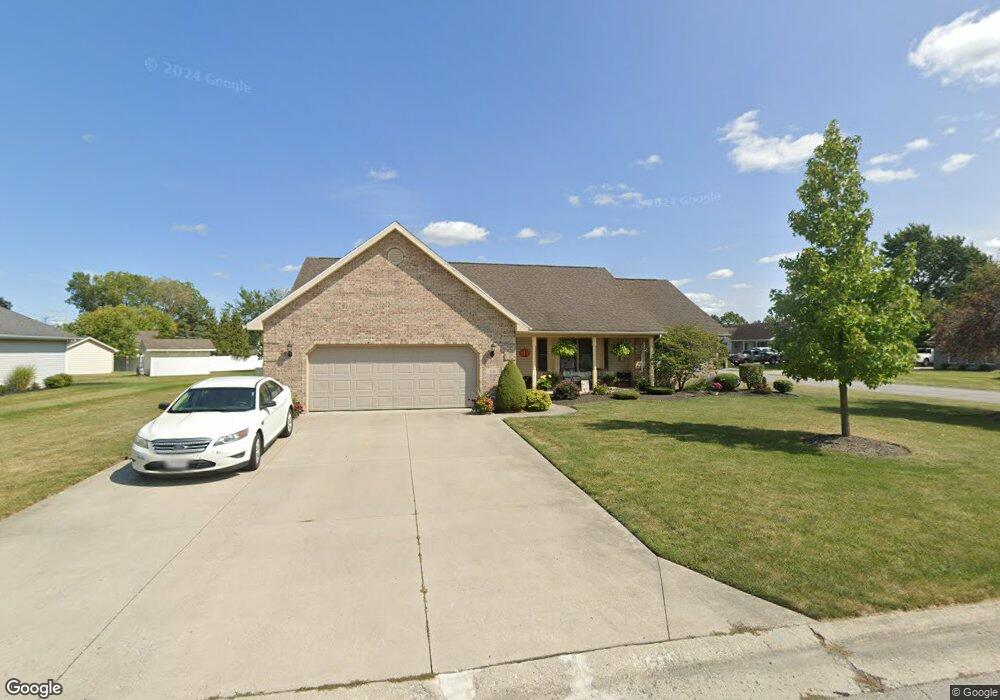
This home is located at 2118 Spruce Dr, Lima, OH 45807 and is currently estimated at $323,153, approximately $151 per square foot. 2118 Spruce Dr is a home located in Allen County with nearby schools including Elida Elementary School, Elida Middle School, and Elida High School.
Ownership History
Date
Name
Owned For
Owner Type
Purchase Details
Closed on
Sep 2, 2021
Sold by
Koverman Kathryn Ann
Bought by
Schleh John D and Schleh Colleen B
Current Estimated Value
Home Financials for this Owner
Home Financials are based on the most recent Mortgage that was taken out on this home.
Original Mortgage
$185,250
Outstanding Balance
$168,312
Interest Rate
2.7%
Mortgage Type
New Conventional
Estimated Equity
$154,841
Purchase Details
Closed on
Jan 20, 2017
Bought by
Mary Kathryn Ak Pease
Purchase Details
Closed on
Oct 5, 1999
Sold by
Good David
Bought by
Nusbaum Mark and Nusbaum Krista
Home Financials for this Owner
Home Financials are based on the most recent Mortgage that was taken out on this home.
Original Mortgage
$78,500
Interest Rate
7.93%
Mortgage Type
New Conventional
Create a Home Valuation Report for This Property
The Home Valuation Report is an in-depth analysis detailing your home's value as well as a comparison with similar homes in the area
Purchase History
| Date | Buyer | Sale Price | Title Company |
|---|---|---|---|
| Schleh John D | $195,000 | None Available | |
| Mary Kathryn Ak Pease | -- | -- | |
| Nusbaum Mark | $21,000 | -- |
Source: Public Records
Mortgage History
| Date | Status | Borrower | Loan Amount |
|---|---|---|---|
| Open | Schleh John D | $185,250 | |
| Previous Owner | Nusbaum Mark | $78,500 |
Source: Public Records
Tax History
| Year | Tax Paid | Tax Assessment Tax Assessment Total Assessment is a certain percentage of the fair market value that is determined by local assessors to be the total taxable value of land and additions on the property. | Land | Improvement |
|---|---|---|---|---|
| 2024 | $4,295 | $97,620 | $9,940 | $87,680 |
| 2023 | $3,855 | $75,670 | $7,700 | $67,970 |
| 2022 | $3,795 | $75,670 | $7,700 | $67,970 |
| 2021 | $3,896 | $75,670 | $7,700 | $67,970 |
| 2020 | $3,555 | $63,880 | $7,980 | $55,900 |
| 2019 | $3,555 | $63,880 | $7,980 | $55,900 |
| 2018 | $3,576 | $63,880 | $7,980 | $55,900 |
| 2017 | $2,597 | $57,440 | $7,980 | $49,460 |
| 2016 | $2,618 | $57,440 | $7,980 | $49,460 |
| 2015 | $3,118 | $57,440 | $7,980 | $49,460 |
| 2014 | $3,118 | $65,660 | $7,980 | $57,680 |
| 2013 | $2,845 | $65,660 | $7,980 | $57,680 |
Source: Public Records
Map
Nearby Homes
- 0 Alix Dr
- 2568 Susan Ann Dr
- 2561 Baty Rd
- 4250 Diller Rd
- 4864 Pheasant St
- 0000 Diller Rd
- 2848 Hummingbird St
- 5643 Clover Ridge Dr
- 000 Hummingbird St
- 2877 Whippoorwill Ave
- 0000 Baty Rd
- 5126 Pheasant St
- 114 Roger St
- 2105 Dutch Hollow Rd
- 1955 Dutch Hollow Rd
- 3721 Comanche
- 3790 Comanche Dr
- 3660 Comanche Dr
- 3619 Comanche Dr
- 3624 Comanche Dr
Your Personal Tour Guide
Ask me questions while you tour the home.