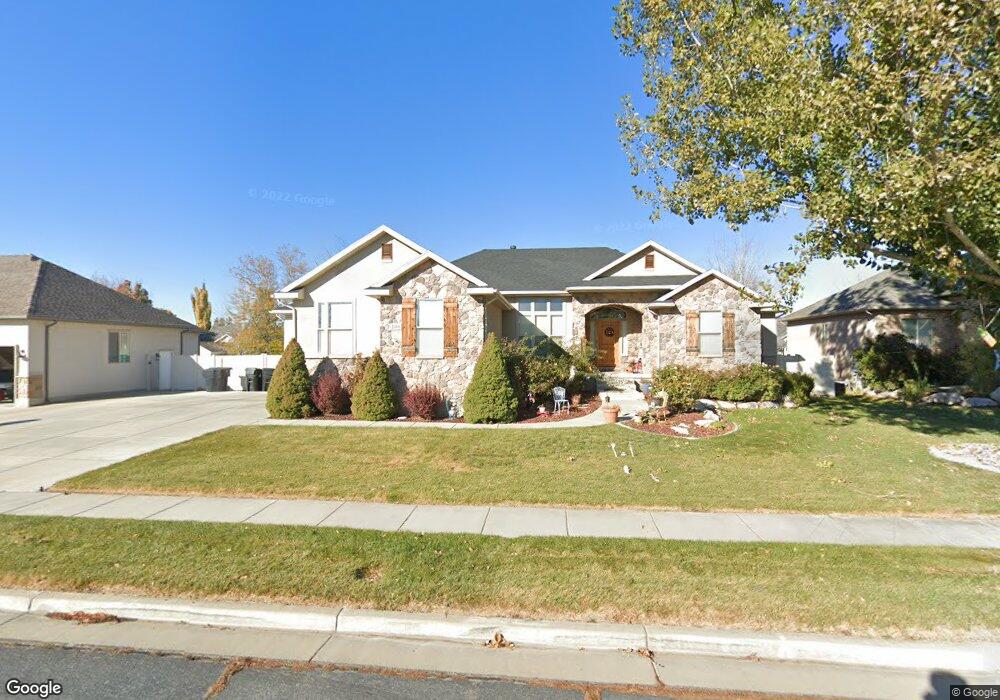
2118 W 2300 S Syracuse, UT 84075
Estimated Value: $647,000 - $696,000
5
Beds
3
Baths
3,590
Sq Ft
$187/Sq Ft
Est. Value
About This Home
This home is located at 2118 W 2300 S, Syracuse, UT 84075 and is currently estimated at $671,261, approximately $186 per square foot. 2118 W 2300 S is a home located in Davis County with nearby schools including Syracuse Elementary School, Syracuse Junior High School, and Syracuse High School.
Ownership History
Date
Name
Owned For
Owner Type
Purchase Details
Closed on
Jun 22, 2020
Sold by
Hall Robert and Hall Melissa
Bought by
Camp Justin J and Camp Julie D
Current Estimated Value
Home Financials for this Owner
Home Financials are based on the most recent Mortgage that was taken out on this home.
Original Mortgage
$321,000
Outstanding Balance
$283,912
Interest Rate
3.2%
Mortgage Type
New Conventional
Estimated Equity
$387,349
Purchase Details
Closed on
Nov 17, 2010
Sold by
Federal Home Loan Mortgage Corporation
Bought by
Hall Robert and Hall Melissa
Home Financials for this Owner
Home Financials are based on the most recent Mortgage that was taken out on this home.
Original Mortgage
$304,735
Interest Rate
4.16%
Mortgage Type
VA
Purchase Details
Closed on
Nov 16, 2010
Sold by
Moore Steven D and Homes Stevenson
Bought by
Federal Home Loan Mortgage Corp
Home Financials for this Owner
Home Financials are based on the most recent Mortgage that was taken out on this home.
Original Mortgage
$304,735
Interest Rate
4.16%
Mortgage Type
VA
Purchase Details
Closed on
Apr 9, 2010
Sold by
Rhees Kaelyn
Bought by
Federal Home Loan Mortgage Corp
Purchase Details
Closed on
Jan 11, 2007
Sold by
Moore Steve D and Moore Amy K
Bought by
Rhees Kaelyn
Home Financials for this Owner
Home Financials are based on the most recent Mortgage that was taken out on this home.
Original Mortgage
$52,600
Interest Rate
6.1%
Mortgage Type
Stand Alone Second
Purchase Details
Closed on
Dec 4, 2006
Sold by
Rhees Kaelyn
Bought by
Rhees Michael R and Rhees Kaelyn
Home Financials for this Owner
Home Financials are based on the most recent Mortgage that was taken out on this home.
Original Mortgage
$52,600
Interest Rate
6.1%
Mortgage Type
Stand Alone Second
Purchase Details
Closed on
Feb 20, 2004
Sold by
Moore Steve D and Moore Amy K
Bought by
Moore Steve D and Moore Amy K
Home Financials for this Owner
Home Financials are based on the most recent Mortgage that was taken out on this home.
Original Mortgage
$201,500
Interest Rate
4%
Mortgage Type
New Conventional
Purchase Details
Closed on
Sep 23, 2003
Sold by
Scott Baker Construction Inc
Bought by
Moore Steve D and Moore Amy K
Home Financials for this Owner
Home Financials are based on the most recent Mortgage that was taken out on this home.
Original Mortgage
$171,400
Interest Rate
6.17%
Mortgage Type
Construction
Create a Home Valuation Report for This Property
The Home Valuation Report is an in-depth analysis detailing your home's value as well as a comparison with similar homes in the area
Home Values in the Area
Average Home Value in this Area
Purchase History
| Date | Buyer | Sale Price | Title Company |
|---|---|---|---|
| Camp Justin J | -- | Old Republic Title | |
| Hall Robert | -- | Bonneville Superior Title Co | |
| Federal Home Loan Mortgage Corp | -- | Bonneville Superior Title Co | |
| Federal Home Loan Mortgage Corp | $294,906 | Etitle Insurance Agency | |
| Rhees Kaelyn | -- | Equity Title Ins Agency Inc | |
| Rhees Michael R | -- | First American Title | |
| Moore Steve D | -- | Backman Stewart Title Svcs | |
| Moore Steve D | -- | Bonneville Title Company Inc |
Source: Public Records
Mortgage History
| Date | Status | Borrower | Loan Amount |
|---|---|---|---|
| Open | Camp Justin J | $321,000 | |
| Previous Owner | Hall Robert | $304,735 | |
| Previous Owner | Rhees Kaelyn | $52,600 | |
| Previous Owner | Rhees Kaelyn | $279,950 | |
| Previous Owner | Moore Steve D | $201,500 | |
| Previous Owner | Moore Steve D | $171,400 |
Source: Public Records
Tax History Compared to Growth
Tax History
| Year | Tax Paid | Tax Assessment Tax Assessment Total Assessment is a certain percentage of the fair market value that is determined by local assessors to be the total taxable value of land and additions on the property. | Land | Improvement |
|---|---|---|---|---|
| 2025 | $3,791 | $365,750 | $126,836 | $238,914 |
| 2024 | $3,584 | $348,150 | $106,708 | $241,442 |
| 2023 | $3,373 | $597,000 | $148,580 | $448,420 |
| 2022 | $3,543 | $343,750 | $85,279 | $258,471 |
| 2021 | $3,162 | $475,000 | $126,230 | $348,770 |
| 2020 | $2,826 | $411,000 | $109,052 | $301,948 |
| 2019 | $2,689 | $386,000 | $107,705 | $278,295 |
| 2018 | $2,512 | $358,000 | $103,421 | $254,579 |
| 2016 | $2,305 | $172,260 | $39,654 | $132,606 |
| 2015 | $2,143 | $152,515 | $39,654 | $112,861 |
| 2014 | $2,034 | $147,546 | $39,654 | $107,892 |
| 2013 | -- | $150,694 | $35,735 | $114,959 |
Source: Public Records
Map
Nearby Homes
- 2104 W 2200 S
- 2136 W 2200 S
- 2306 S 2000 W
- 2297 W 2175 S
- 2237 Craig Ln
- 2194 S 1800 W
- 1932 S 2150 W
- 2503 S 1875 W
- 2208 W 2615 S Unit 141
- 2198 W 2615 S Unit 140
- 2158 W 2615 S Unit 137
- 2650 S 2000 W
- 2082 S 1730 W
- 2154 W 2700 S
- 2574 S 2430 W Unit 503
- 4344 W 1825 S Unit 102
- 4354 W 1825 S Unit 104
- 4348 W 1825 S Unit 103
- 2402 W 2700 S
- Bridgeport Plan at Sadie's Glenn