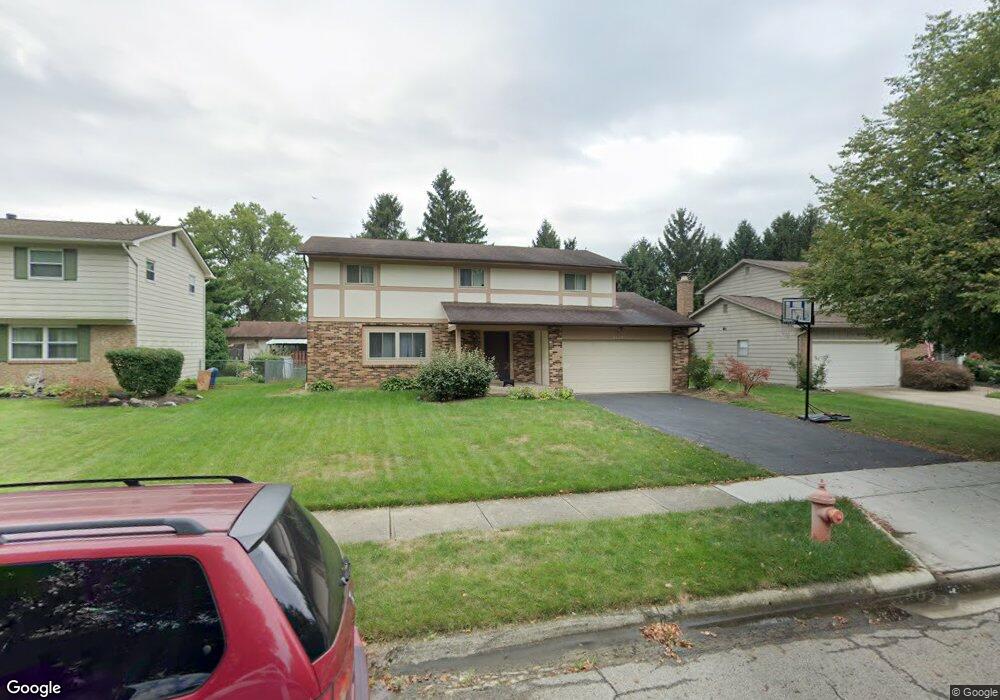
2119 Keltonshire Ave Columbus, OH 43229
Northgate NeighborhoodEstimated Value: $315,000 - $393,000
4
Beds
3
Baths
1,952
Sq Ft
$175/Sq Ft
Est. Value
About This Home
This home is located at 2119 Keltonshire Ave, Columbus, OH 43229 and is currently estimated at $341,597, approximately $174 per square foot. 2119 Keltonshire Ave is a home located in Franklin County with nearby schools including Northgate Intermediate, Alpine Elementary School, and Woodward Park Middle School.
Ownership History
Date
Name
Owned For
Owner Type
Purchase Details
Closed on
Nov 26, 2008
Sold by
Alhart Daryl W and Alhart Reba Kay
Bought by
Abubakar Asha
Current Estimated Value
Home Financials for this Owner
Home Financials are based on the most recent Mortgage that was taken out on this home.
Original Mortgage
$96,187
Outstanding Balance
$64,632
Interest Rate
6.48%
Mortgage Type
FHA
Estimated Equity
$276,965
Purchase Details
Closed on
Aug 6, 2004
Sold by
Alhart Karol E
Bought by
Alhart Daryl W
Home Financials for this Owner
Home Financials are based on the most recent Mortgage that was taken out on this home.
Original Mortgage
$111,000
Interest Rate
6.34%
Mortgage Type
Purchase Money Mortgage
Purchase Details
Closed on
Dec 17, 1993
Bought by
Alhart Daryl W and Alhart Karol E
Create a Home Valuation Report for This Property
The Home Valuation Report is an in-depth analysis detailing your home's value as well as a comparison with similar homes in the area
Home Values in the Area
Average Home Value in this Area
Purchase History
| Date | Buyer | Sale Price | Title Company |
|---|---|---|---|
| Abubakar Asha | $105,000 | Northwest T | |
| Alhart Daryl W | -- | -- | |
| Alhart Daryl W | $116,000 | -- |
Source: Public Records
Mortgage History
| Date | Status | Borrower | Loan Amount |
|---|---|---|---|
| Open | Abubakar Asha | $96,187 | |
| Previous Owner | Alhart Daryl W | $111,000 |
Source: Public Records
Tax History Compared to Growth
Tax History
| Year | Tax Paid | Tax Assessment Tax Assessment Total Assessment is a certain percentage of the fair market value that is determined by local assessors to be the total taxable value of land and additions on the property. | Land | Improvement |
|---|---|---|---|---|
| 2024 | $4,467 | $99,540 | $21,420 | $78,120 |
| 2023 | $4,410 | $99,540 | $21,420 | $78,120 |
| 2022 | $3,458 | $66,680 | $14,700 | $51,980 |
| 2021 | $3,465 | $66,680 | $14,700 | $51,980 |
| 2020 | $3,469 | $66,680 | $14,700 | $51,980 |
| 2019 | $3,242 | $53,450 | $11,760 | $41,690 |
| 2018 | $2,973 | $53,450 | $11,760 | $41,690 |
| 2017 | $3,113 | $53,450 | $11,760 | $41,690 |
| 2016 | $2,986 | $45,080 | $8,470 | $36,610 |
| 2015 | $2,711 | $45,080 | $8,470 | $36,610 |
| 2014 | $2,717 | $45,080 | $8,470 | $36,610 |
| 2013 | $1,489 | $50,085 | $9,415 | $40,670 |
Source: Public Records
Map
Nearby Homes
- 2197 Bayfield Dr
- 2120 Willowick Dr Unit B
- 6448 Sharon Woods Blvd Unit B
- 6355 Johnanne St
- 6245 Sharon Woods Blvd
- 2292 Laurelwood Dr Unit 2292L
- 6496 Hearthstone Ave
- 6048 Pinemoor St
- 1947 Rockdale Dr Unit 33
- 6407 Skywae Dr
- 6658 Walbridge St
- 2250 Webster Canyon Ct
- 6342 Bellmeadow Dr
- 2623 Blendon Woods Blvd
- 1635 Tendril Ct
- 6458 Faircrest Rd
- 6407 Faircrest Rd
- 2677-2679 Blossom Ave
- 2727 Patrick Ave
- 5732 Beechcroft Rd Unit B
- 2125 Keltonshire Ave
- 2107 Keltonshire Ave
- 2112 Jewett Dr Unit 114
- 2120 Jewett Dr Unit 122
- 2139 Keltonshire Ave
- 2104 Jewett Dr Unit 106
- 2101 Keltonshire Ave
- 2104-2106 Jewett Dr
- 2134 Jewett Dr Unit 136
- 2120 Keltonshire Ave
- 2108 Keltonshire Ave
- 2132 Jewett Dr
- 2092 Jewett Dr Unit 94
- 2092-2094 Jewett Dr
- 2142 Jewett Dr Unit 144
- 6336 Stonebridge St
- 2145 Keltonshire Ave
- 2093 Keltonshire Ave
- 6337 Birkewood St
- 6344 Stonebridge St