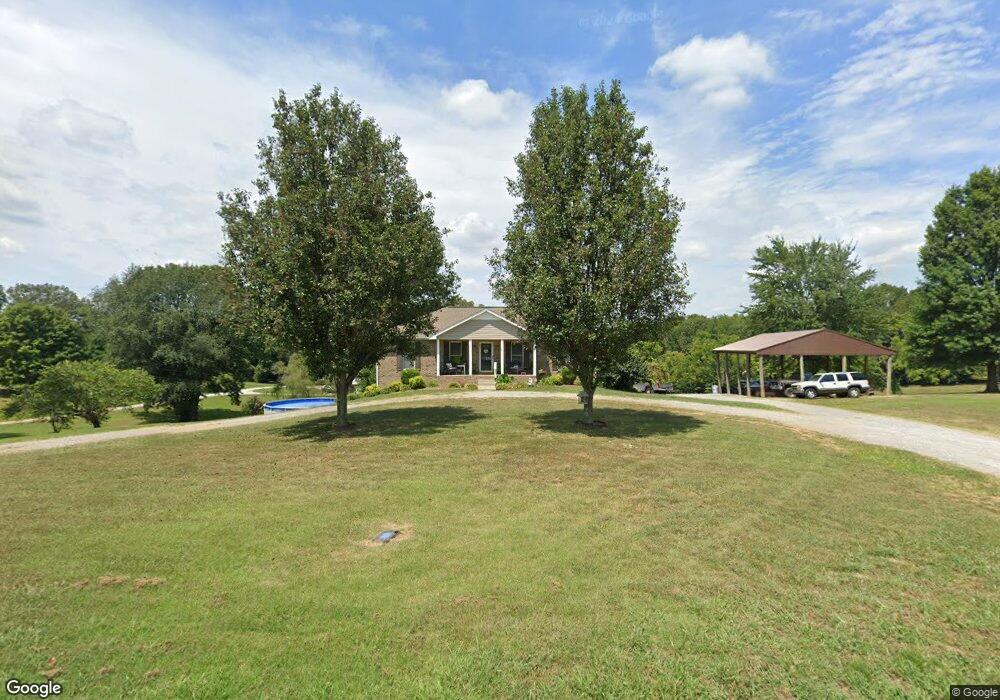
2119 Lock B Rd N Clarksville, TN 37043
Estimated Value: $323,000 - $385,000
--
Bed
2
Baths
1,470
Sq Ft
$239/Sq Ft
Est. Value
About This Home
This home is located at 2119 Lock B Rd N, Clarksville, TN 37043 and is currently estimated at $351,700, approximately $239 per square foot. 2119 Lock B Rd N is a home located in Montgomery County with nearby schools including East Montgomery Elementary School, Richview Middle School, and Clarksville High School.
Ownership History
Date
Name
Owned For
Owner Type
Purchase Details
Closed on
Feb 26, 2010
Sold by
Boykin Joseph L
Bought by
Wooden Justin S
Current Estimated Value
Home Financials for this Owner
Home Financials are based on the most recent Mortgage that was taken out on this home.
Original Mortgage
$176,641
Outstanding Balance
$116,429
Interest Rate
4.87%
Mortgage Type
FHA
Estimated Equity
$235,271
Purchase Details
Closed on
Dec 14, 2007
Sold by
Crowe Todd E
Bought by
Boykin Joseph L
Home Financials for this Owner
Home Financials are based on the most recent Mortgage that was taken out on this home.
Original Mortgage
$121,448
Interest Rate
6.21%
Purchase Details
Closed on
Sep 26, 2003
Sold by
Wilson Michael L
Bought by
Crowe Todd E
Purchase Details
Closed on
Apr 29, 1997
Sold by
Wilson Fulton
Bought by
Wilson Michael L
Purchase Details
Closed on
Jul 12, 1996
Sold by
Taylor Ronald C
Bought by
Wilson Fulton
Create a Home Valuation Report for This Property
The Home Valuation Report is an in-depth analysis detailing your home's value as well as a comparison with similar homes in the area
Home Values in the Area
Average Home Value in this Area
Purchase History
| Date | Buyer | Sale Price | Title Company |
|---|---|---|---|
| Wooden Justin S | $179,900 | -- | |
| Boykin Joseph L | $142,880 | -- | |
| Crowe Todd E | $115,000 | -- | |
| Wilson Michael L | $102,500 | -- | |
| Wilson Fulton | $8,000 | -- |
Source: Public Records
Mortgage History
| Date | Status | Borrower | Loan Amount |
|---|---|---|---|
| Open | Wilson Fulton | $176,641 | |
| Previous Owner | Wilson Fulton | $121,448 |
Source: Public Records
Tax History Compared to Growth
Tax History
| Year | Tax Paid | Tax Assessment Tax Assessment Total Assessment is a certain percentage of the fair market value that is determined by local assessors to be the total taxable value of land and additions on the property. | Land | Improvement |
|---|---|---|---|---|
| 2024 | $1,904 | $90,650 | $0 | $0 |
| 2023 | $1,904 | $50,775 | $0 | $0 |
| 2022 | $1,518 | $50,775 | $0 | $0 |
| 2021 | $1,518 | $48,800 | $0 | $0 |
| 2020 | $1,459 | $48,800 | $0 | $0 |
| 2019 | $1,459 | $48,800 | $0 | $0 |
| 2018 | $1,394 | $39,700 | $0 | $0 |
| 2017 | $1,394 | $45,400 | $0 | $0 |
| 2016 | $1,394 | $45,400 | $0 | $0 |
| 2015 | $1,351 | $45,400 | $0 | $0 |
| 2014 | $1,351 | $45,400 | $0 | $0 |
| 2013 | $1,101 | $35,050 | $0 | $0 |
Source: Public Records
Map
Nearby Homes
- 2105 Lock B Rd N
- 1870 Hickory Point Rd
- 1800 Hickory Point Rd
- 2355 Davidson Graveyard Rd
- 2264 Lock B Rd N
- 2526 Bearden Rd
- 7 Jarrell Ridge Rd
- 1 Jarrell Ridge Rd
- 2 Jarrell Ridge Rd
- 3 Jarrell Ridge Rd
- 8 Jarrell Ridge Rd
- 1640 Harvill Rd
- 2635 Lock B Rd N
- 1680 Heritage Dr
- 2670 Jarrell Ridge Rd
- 4565 Old Ashland City Rd S
- 4392 Ashland City Rd
- 2660 Jarrell Ridge Rd
- 0 Gholson Rd
- 0 Southside Rd
- 2115 Lock B Rd N
- 4 Lock B Rd N
- 0 Lock B Rd N
- 3 Lock B Rd N
- 2 Lock B Rd N
- 2127 Lock B Rd N
- 2109 Lock B Rd N
- 2123 Lock B Rd N
- 2128 Lock B Rd N
- 2126 Lock B Rd N
- 2130 Lock B Rd N
- 2116 Lock B Rd N
- 2131 Lock B Rd N
- 2078 Lock B Rd N
- 2135 Lock B Rd N
- 2075 Lock B Rd N
- 2139 Lock B Rd N
- 2138 Lock B Rd N
- 2074 Lock B Rd N
- 2147 Lock B Rd N