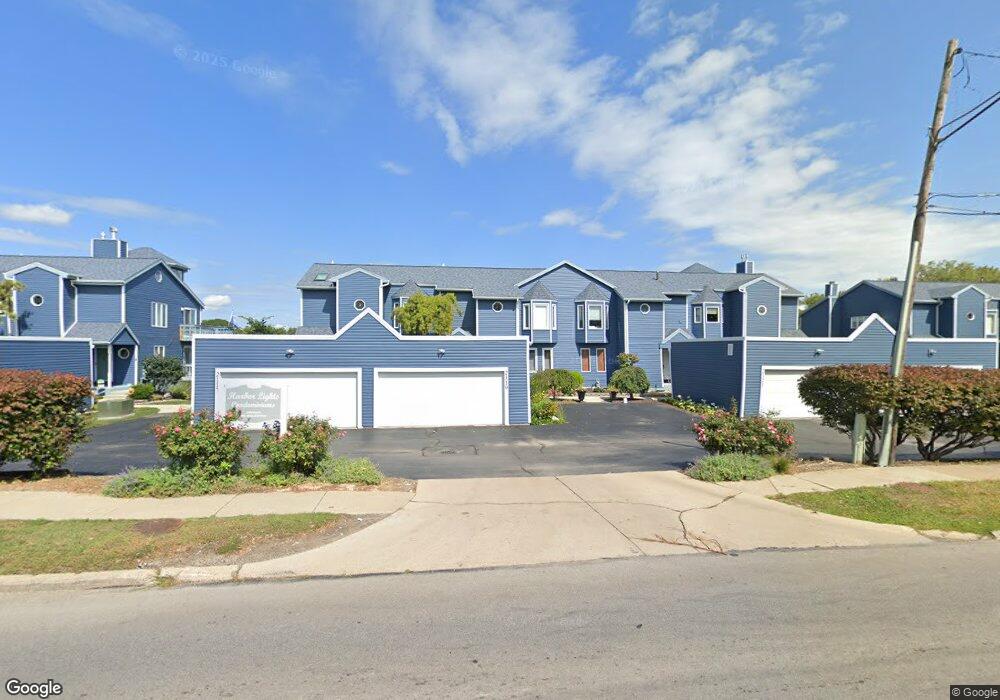
2119 Ottawa River Rd Unit 4B Toledo, OH 43611
Point Place NeighborhoodEstimated Value: $123,000 - $242,000
3
Beds
2
Baths
1,506
Sq Ft
$129/Sq Ft
Est. Value
About This Home
This home is located at 2119 Ottawa River Rd Unit 4B, Toledo, OH 43611 and is currently estimated at $193,756, approximately $128 per square foot. 2119 Ottawa River Rd Unit 4B is a home located in Lucas County with nearby schools including Shoreland Elementary School, Washington Junior High School, and Jefferson Junior High School.
Ownership History
Date
Name
Owned For
Owner Type
Purchase Details
Closed on
Dec 31, 2021
Sold by
Louisville Title Agency For N W Ohio Inc
Bought by
Zaremba Thomas S
Current Estimated Value
Purchase Details
Closed on
Sep 14, 1998
Sold by
Seeburger Gilbert C and Seeburger Diane M
Bought by
Louisville Title Agency For N W Ohio Inc
Purchase Details
Closed on
Sep 3, 1996
Sold by
Gerrad Nyla
Bought by
Seeburger Gilbert C and Seeburger Diane M
Home Financials for this Owner
Home Financials are based on the most recent Mortgage that was taken out on this home.
Original Mortgage
$104,000
Interest Rate
8.3%
Mortgage Type
New Conventional
Purchase Details
Closed on
Mar 2, 1992
Sold by
Ertle Ertle R R and Ertle Nancy S
Purchase Details
Closed on
Jun 23, 1988
Create a Home Valuation Report for This Property
The Home Valuation Report is an in-depth analysis detailing your home's value as well as a comparison with similar homes in the area
Home Values in the Area
Average Home Value in this Area
Purchase History
| Date | Buyer | Sale Price | Title Company |
|---|---|---|---|
| Zaremba Thomas S | -- | None Available | |
| Louisville Title Agency For N W Ohio Inc | $127,000 | -- | |
| Seeburger Gilbert C | $130,000 | -- | |
| -- | $107,000 | -- | |
| -- | $107,000 | -- |
Source: Public Records
Mortgage History
| Date | Status | Borrower | Loan Amount |
|---|---|---|---|
| Previous Owner | Seeburger Gilbert C | $104,000 |
Source: Public Records
Tax History Compared to Growth
Tax History
| Year | Tax Paid | Tax Assessment Tax Assessment Total Assessment is a certain percentage of the fair market value that is determined by local assessors to be the total taxable value of land and additions on the property. | Land | Improvement |
|---|---|---|---|---|
| 2024 | $1,645 | $55,370 | $8,085 | $47,285 |
| 2023 | $2,852 | $40,845 | $6,615 | $34,230 |
| 2022 | $2,839 | $40,845 | $6,615 | $34,230 |
| 2021 | $2,915 | $40,845 | $6,615 | $34,230 |
| 2020 | $3,188 | $38,815 | $5,355 | $33,460 |
| 2019 | $3,096 | $38,815 | $5,355 | $33,460 |
| 2018 | $2,592 | $38,815 | $5,355 | $33,460 |
| 2017 | $2,366 | $30,380 | $3,710 | $26,670 |
| 2016 | $2,355 | $86,800 | $10,600 | $76,200 |
| 2015 | $2,362 | $86,800 | $10,600 | $76,200 |
| 2014 | $2,070 | $30,380 | $3,710 | $26,670 |
| 2013 | $2,070 | $30,380 | $3,710 | $26,670 |
Source: Public Records
Map
Nearby Homes
- 4828 287th St
- 4492 283rd St
- 2240 Ruthanne Dr
- 2532 102nd St
- 5504 Ketukkee Trail
- 4314 Dahlia Dr
- 4441 290th St
- 5454 Brook Point Rd
- 5331 Whitehouse Dr
- 5534 Suder Ave
- 2641 117th St
- 4811 298th St
- 5457 Thornbrook Trail
- 4252 289th St
- 5433 Brophy Dr
- 2730 109th St
- 2434 Roseann Dr
- 2642 124th St
- 2211 E Harbor Dr
- 4755 301st St
- 2117 Ottawa River Rd
- 2117 Ottawa River Rd Unit 4A
- 2111 Ottawa River Rd Unit 3D
- 2109 Ottawa River Rd Unit 3C
- 2121 Ottawa River Rd Unit 4C
- 2123 Ottawa River Rd Unit 4D
- 2131 Ottawa River Rd
- 2131 Ottawa River Rd
- 2131 Ottawa River Rd Unit 5A
- 2135 Ottawa River Rd Unit 5B
- 2137 Ottawa River Rd Unit 5C
- 2132 Ottawa River Rd
- 2107 Ottawa River Rd Unit B
- 2107 Ottawa River Rd Unit 3B
- 2104 Ottawa River Rd
- 2112 Ottawa River Rd
- 2139 Ottawa River Rd Unit 5D
- 2105 Ottawa River Rd
- 2105 Ottawa River Rd Unit 5C
- 2136 Ottawa River Rd