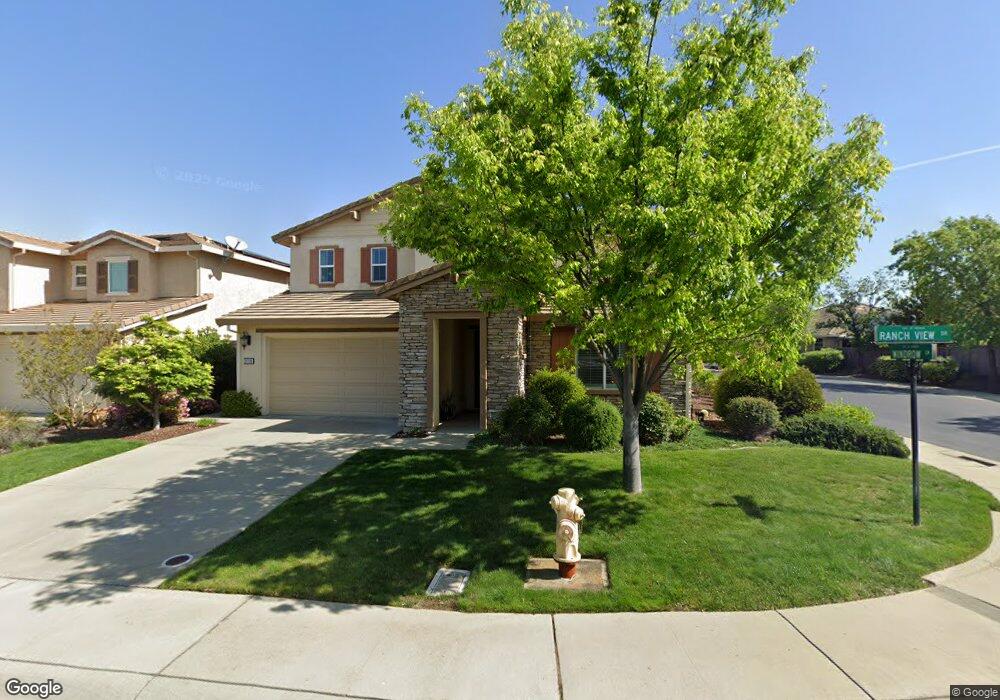
2119 Ranch View Dr Rocklin, CA 95765
Whitney Ranch NeighborhoodEstimated Value: $387,000 - $983,000
5
Beds
3
Baths
3,498
Sq Ft
$230/Sq Ft
Est. Value
About This Home
This home is located at 2119 Ranch View Dr, Rocklin, CA 95765 and is currently estimated at $805,107, approximately $230 per square foot. 2119 Ranch View Dr is a home located in Placer County with nearby schools including Sunset Ranch Elementary, Granite Oaks Middle, and Whitney High.
Ownership History
Date
Name
Owned For
Owner Type
Purchase Details
Closed on
Apr 19, 2017
Sold by
Montojo Peter S and Montojo Haidee
Bought by
Montojo Peter and Montojo Haidee
Current Estimated Value
Purchase Details
Closed on
Aug 2, 2013
Sold by
Deguzman Adelbert and Deguzman Tanya Blue
Bought by
Deguzman Adelbert R and Deguzman Tanya Blue R
Home Financials for this Owner
Home Financials are based on the most recent Mortgage that was taken out on this home.
Original Mortgage
$368,500
Outstanding Balance
$268,818
Interest Rate
3.92%
Mortgage Type
New Conventional
Estimated Equity
$536,289
Purchase Details
Closed on
Jun 17, 2011
Sold by
Standard Pacific Corp
Bought by
Deguzman Adelbert and Deguzman Tanya Blue
Home Financials for this Owner
Home Financials are based on the most recent Mortgage that was taken out on this home.
Original Mortgage
$362,569
Interest Rate
4.46%
Mortgage Type
FHA
Purchase Details
Closed on
Dec 19, 2008
Sold by
Standard Pacific Whitney Village 8 Llc
Bought by
Standard Pacific Corp
Create a Home Valuation Report for This Property
The Home Valuation Report is an in-depth analysis detailing your home's value as well as a comparison with similar homes in the area
Home Values in the Area
Average Home Value in this Area
Purchase History
| Date | Buyer | Sale Price | Title Company |
|---|---|---|---|
| Montojo Peter | -- | None Available | |
| Deguzman Adelbert R | -- | First American Title Company | |
| Deguzman Adelbert | $372,000 | First American Title Company | |
| Standard Pacific Corp | -- | First American Title |
Source: Public Records
Mortgage History
| Date | Status | Borrower | Loan Amount |
|---|---|---|---|
| Open | Deguzman Adelbert R | $368,500 | |
| Closed | Deguzman Adelbert | $362,569 |
Source: Public Records
Tax History Compared to Growth
Tax History
| Year | Tax Paid | Tax Assessment Tax Assessment Total Assessment is a certain percentage of the fair market value that is determined by local assessors to be the total taxable value of land and additions on the property. | Land | Improvement |
|---|---|---|---|---|
| 2025 | $8,296 | $467,240 | $100,478 | $366,762 |
| 2023 | $8,296 | $449,098 | $96,577 | $352,521 |
| 2022 | $8,000 | $440,293 | $94,684 | $345,609 |
| 2021 | $7,795 | $431,661 | $92,828 | $338,833 |
| 2020 | $7,730 | $427,236 | $91,877 | $335,359 |
| 2019 | $7,602 | $418,860 | $90,076 | $328,784 |
| 2018 | $7,409 | $410,648 | $88,310 | $322,338 |
| 2017 | $7,334 | $402,597 | $86,579 | $316,018 |
| 2016 | $7,464 | $394,704 | $84,882 | $309,822 |
| 2015 | $7,353 | $388,776 | $83,607 | $305,169 |
| 2014 | $7,206 | $381,162 | $81,970 | $299,192 |
Source: Public Records
Map
Nearby Homes
- 807 Calico Dr
- 607 Open Range Ln
- 706 Wagon Trail Way
- 847 Calico Dr
- 947 Old Ranch House Ct
- 848 Calico Dr
- 807 Lazy Creek Dr
- 312 Charnwood Ct
- 804 Berry Creek Dr
- 2955 Cardinal Dr
- 925 Farm House Ct
- 213 Soaring Hawk Place
- 2901 Quicksilver Ct
- 947 Campfire Cir
- 2671 Southcreek Dr
- 946 Campfire Cir
- 2916 Kiwi Ln
- 2252 Ranch View Dr
- 1617 Arroyo Sierra Way
- 1642 Abilene Cir
- 2117 Ranch View Dr
- 2218 Telegraph Hill Dr
- 2123 Ranch View Dr
- 2115 Ranch View Dr
- 2216 Telegraph Hill Dr
- 2222 Telegraph Hill Ct
- 2118 Ranch View Dr
- 2125 Ranch View Dr
- 2113 Ranch View Dr
- 2116 Ranch View Dr
- 2120 Ranch View Dr
- 2214 Telegraph Hill Dr
- 2122 Ranch View Dr
- 2112 Ranch View Dr
- 2111 Ranch View Dr
- 2224 Telegraph Hill Ct
- 2127 Ranch View Dr
- 2124 Ranch View Dr
- 2226 Telegraph Hill Ct
- 2212 Telegraph Hill Dr