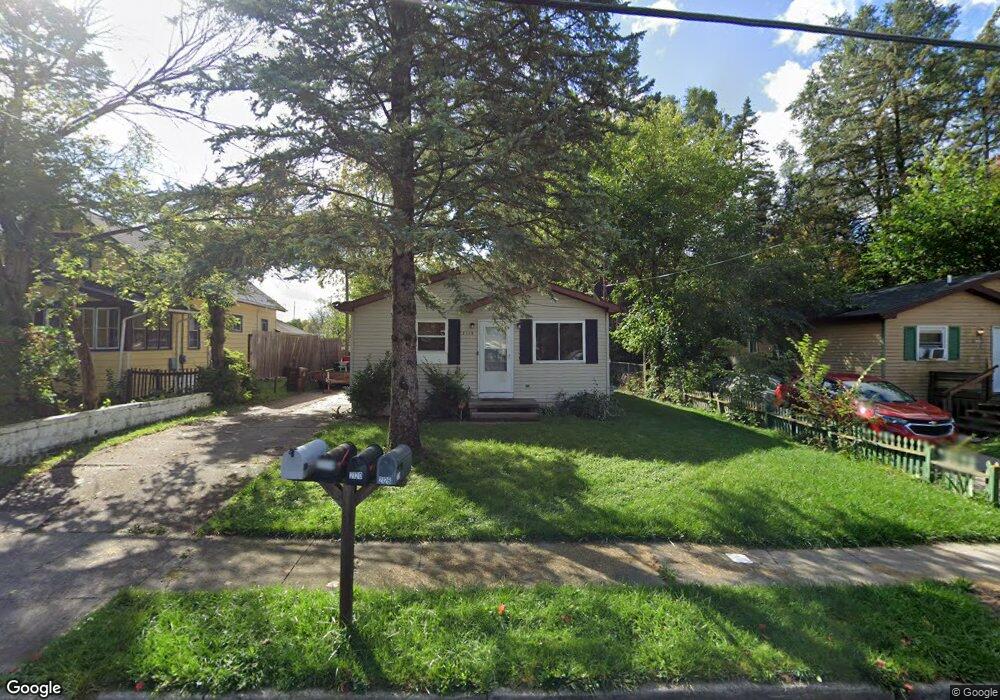
2119 Webster St Lansing, MI 48911
Southern Lansing NeighborhoodEstimated Value: $151,000 - $154,000
3
Beds
1
Bath
960
Sq Ft
$159/Sq Ft
Est. Value
About This Home
This home is located at 2119 Webster St, Lansing, MI 48911 and is currently estimated at $152,492, approximately $158 per square foot. 2119 Webster St is a home located in Ingham County with nearby schools including Reo Elementary School, Attwood School, and Everett High School.
Ownership History
Date
Name
Owned For
Owner Type
Purchase Details
Closed on
Oct 19, 2011
Sold by
Not Far From Home Llc
Bought by
Peck David
Current Estimated Value
Home Financials for this Owner
Home Financials are based on the most recent Mortgage that was taken out on this home.
Original Mortgage
$61,304
Outstanding Balance
$41,852
Interest Rate
4.12%
Mortgage Type
FHA
Estimated Equity
$110,640
Purchase Details
Closed on
Feb 10, 2011
Sold by
Anderson Alfred
Bought by
Hsbc Mortgage Services Inc
Purchase Details
Closed on
May 15, 2003
Sold by
Fitch Norfleet and Fitch Arie
Bought by
Us Bank Na and Csfb Abs Trust Series 2001-He4
Purchase Details
Closed on
Mar 31, 2001
Sold by
Messieha Mark and Messieah Mark
Bought by
Fitch Norfleet
Home Financials for this Owner
Home Financials are based on the most recent Mortgage that was taken out on this home.
Original Mortgage
$61,600
Interest Rate
11.87%
Mortgage Type
Purchase Money Mortgage
Purchase Details
Closed on
Jan 6, 2000
Sold by
Fitch Norfleet and Fitch Arie
Bought by
Messieah Mark
Purchase Details
Closed on
Jan 15, 1999
Sold by
Fitch Norfleet and Fitch Arie L
Bought by
Sterling Bank & Trust Fsb
Purchase Details
Closed on
Oct 3, 1997
Sold by
Ingham Cty Sheriff
Bought by
First Union Home Equity Bank
Create a Home Valuation Report for This Property
The Home Valuation Report is an in-depth analysis detailing your home's value as well as a comparison with similar homes in the area
Home Values in the Area
Average Home Value in this Area
Purchase History
| Date | Buyer | Sale Price | Title Company |
|---|---|---|---|
| Peck David | $62,900 | Bell Title Company | |
| Hsbc Mortgage Services Inc | $44,280 | None Available | |
| Us Bank Na | $68,980 | -- | |
| Fitch Norfleet | $57,600 | -- | |
| Messieah Mark | $48,000 | -- | |
| Sterling Bank & Trust Fsb | $51,578 | -- | |
| First Union Home Equity Bank | $48,000 | -- |
Source: Public Records
Mortgage History
| Date | Status | Borrower | Loan Amount |
|---|---|---|---|
| Open | Peck David | $61,304 | |
| Previous Owner | Fitch Norfleet | $61,600 |
Source: Public Records
Tax History
| Year | Tax Paid | Tax Assessment Tax Assessment Total Assessment is a certain percentage of the fair market value that is determined by local assessors to be the total taxable value of land and additions on the property. | Land | Improvement |
|---|---|---|---|---|
| 2025 | $2,292 | $72,200 | $7,200 | $65,000 |
| 2024 | $18 | $58,000 | $7,200 | $50,800 |
| 2023 | $2,150 | $50,000 | $7,200 | $42,800 |
| 2022 | $1,941 | $43,600 | $5,100 | $38,500 |
| 2021 | $1,901 | $42,600 | $5,000 | $37,600 |
| 2020 | $1,889 | $38,800 | $5,000 | $33,800 |
| 2019 | $1,809 | $34,500 | $5,000 | $29,500 |
| 2018 | $1,697 | $32,100 | $5,000 | $27,100 |
| 2017 | $1,624 | $32,100 | $5,000 | $27,100 |
| 2016 | $1,553 | $30,600 | $5,000 | $25,600 |
| 2015 | $1,553 | $29,300 | $10,087 | $19,213 |
| 2014 | $1,553 | $27,100 | $15,692 | $11,408 |
Source: Public Records
Map
Nearby Homes
- 2411 Bliesener St
- 5838 S Martin Luther King Junior Blvd
- 5650 Hughes Rd
- 6037 Hughes Rd
- 5902 Haag Rd
- 1406 Weymouth Ct
- 1309 Penrod Ct
- 3220 W Miller Rd
- 5641 Ashley Dr
- 2416 Midwood St
- 2918 Midwood St
- 0 Midwood St
- 1020 R G Curtiss Ave
- 2706 W Jolly Rd
- 1006 Attwood Dr
- 5017 Christiansen Rd
- 4928 Hughes Rd
- 4927 Starr Ave
- 826 R G Curtiss Ave
- 1001 Ferley St
Your Personal Tour Guide
Ask me questions while you tour the home.