212 18th St NE Cedar Rapids, IA 52402
Mound View NeighborhoodEstimated Value: $116,000 - $161,000
5
Beds
2
Baths
2,185
Sq Ft
$62/Sq Ft
Est. Value
About This Home
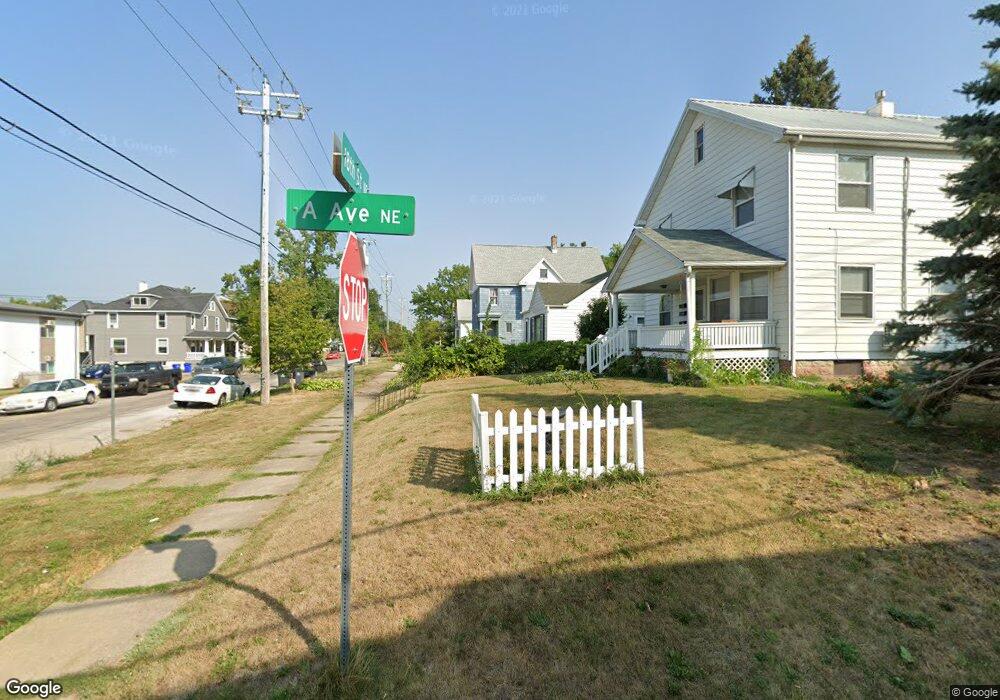
This home is located at 212 18th St NE, Cedar Rapids, IA 52402 and is currently estimated at $135,764, approximately $62 per square foot. 212 18th St NE is a home located in Linn County with nearby schools including Franklin Middle School, George Washington High School, and St. Matthew School.
Ownership History
Date
Name
Owned For
Owner Type
Purchase Details
Closed on
Mar 30, 2007
Sold by
Johnston Mark C
Bought by
Gillson Heather K
Current Estimated Value
Home Financials for this Owner
Home Financials are based on the most recent Mortgage that was taken out on this home.
Original Mortgage
$68,500
Interest Rate
6.25%
Mortgage Type
Purchase Money Mortgage
Purchase Details
Closed on
Nov 21, 2003
Sold by
Brennan Patrick J
Bought by
Johnston Mark C
Home Financials for this Owner
Home Financials are based on the most recent Mortgage that was taken out on this home.
Original Mortgage
$58,200
Interest Rate
6.07%
Mortgage Type
Unknown
Purchase Details
Closed on
Oct 15, 2002
Sold by
Mayer Sherrie
Bought by
Duball David A
Home Financials for this Owner
Home Financials are based on the most recent Mortgage that was taken out on this home.
Original Mortgage
$36,205
Interest Rate
7.25%
Create a Home Valuation Report for This Property
The Home Valuation Report is an in-depth analysis detailing your home's value as well as a comparison with similar homes in the area
Home Values in the Area
Average Home Value in this Area
Purchase History
| Date | Buyer | Sale Price | Title Company |
|---|---|---|---|
| Gillson Heather K | $68,000 | None Available | |
| Johnston Mark C | $59,500 | -- | |
| Duball David A | $26,500 | -- |
Source: Public Records
Mortgage History
| Date | Status | Borrower | Loan Amount |
|---|---|---|---|
| Previous Owner | Gillson Heather K | $68,500 | |
| Previous Owner | Johnston Mark C | $58,200 | |
| Previous Owner | Duball David A | $36,205 |
Source: Public Records
Tax History
| Year | Tax Paid | Tax Assessment Tax Assessment Total Assessment is a certain percentage of the fair market value that is determined by local assessors to be the total taxable value of land and additions on the property. | Land | Improvement |
|---|---|---|---|---|
| 2025 | $1,446 | $96,700 | $34,300 | $62,400 |
| 2024 | $1,702 | $102,700 | $31,700 | $71,000 |
| 2023 | $1,702 | $92,200 | $26,400 | $65,800 |
| 2022 | $1,628 | $89,600 | $26,400 | $63,200 |
| 2021 | $1,596 | $87,500 | $26,400 | $61,100 |
| 2020 | $1,596 | $80,900 | $26,400 | $54,500 |
| 2019 | $1,412 | $74,000 | $26,400 | $47,600 |
Source: Public Records
Map
Nearby Homes
- 8821 Zeppelin Ave NE
- 1720 2nd Ave SE
- 1645 D Ave NE
- 507 19th St NE
- 1608 B Ave NE
- 430 Longwood Dr NE
- 1953 1st Ave NE Unit 301
- 1953 1st Ave SE Unit 301
- 1953 1st Ave SE Unit 503
- 514 16th St NE
- 335 18th St SE
- 122 20th St NE
- 1704 Park Ave SE
- 1730 Park Ave SE
- 419 21st St NE
- 1900 Park Ave SE
- 1426 3rd Ave SE
- 1906 Park Ave SE
- 2009 Blake Blvd SE
- 1545 Washington Ave SE
Your Personal Tour Guide
Ask me questions while you tour the home.