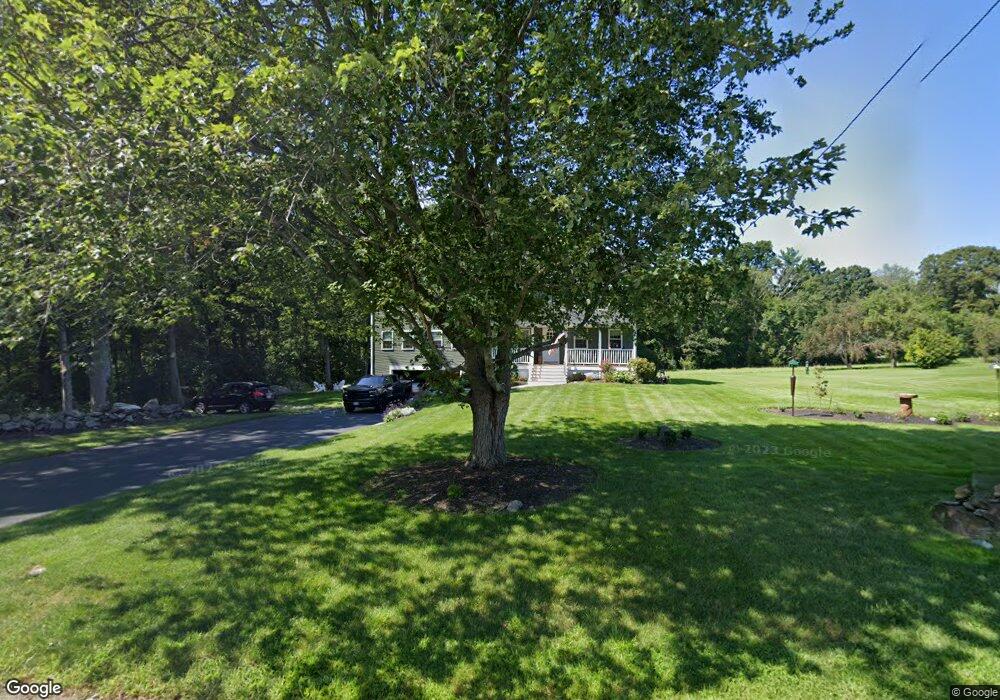
212 8 Lots Rd Sutton, MA 01590
Estimated Value: $744,084 - $1,009,000
4
Beds
3
Baths
2,484
Sq Ft
$358/Sq Ft
Est. Value
About This Home
This home is located at 212 8 Lots Rd, Sutton, MA 01590 and is currently estimated at $889,271, approximately $357 per square foot. 212 8 Lots Rd is a home located in Worcester County with nearby schools including Sutton Elementary School, Sutton Middle School, and Sutton High School.
Ownership History
Date
Name
Owned For
Owner Type
Purchase Details
Closed on
May 11, 2018
Sold by
Israel Real Estate Co
Bought by
Walker Thomas and Walker Jaime
Current Estimated Value
Home Financials for this Owner
Home Financials are based on the most recent Mortgage that was taken out on this home.
Original Mortgage
$453,000
Outstanding Balance
$390,407
Interest Rate
4.44%
Mortgage Type
New Conventional
Estimated Equity
$498,864
Purchase Details
Closed on
Jan 20, 2017
Sold by
Fhlmc
Bought by
Israel Real Estate Co
Purchase Details
Closed on
Mar 31, 2016
Sold by
Campbell Mark D
Bought by
Fhlmc
Purchase Details
Closed on
Sep 27, 1989
Sold by
Deboer Robert
Bought by
Campbell Mark
Home Financials for this Owner
Home Financials are based on the most recent Mortgage that was taken out on this home.
Original Mortgage
$140,967
Interest Rate
9.92%
Mortgage Type
Purchase Money Mortgage
Create a Home Valuation Report for This Property
The Home Valuation Report is an in-depth analysis detailing your home's value as well as a comparison with similar homes in the area
Home Values in the Area
Average Home Value in this Area
Purchase History
| Date | Buyer | Sale Price | Title Company |
|---|---|---|---|
| Walker Thomas | $515,000 | -- | |
| Israel Real Estate Co | $185,000 | -- | |
| Fhlmc | $229,600 | -- | |
| Campbell Mark | $158,000 | -- |
Source: Public Records
Mortgage History
| Date | Status | Borrower | Loan Amount |
|---|---|---|---|
| Open | Walker Thomas | $453,000 | |
| Previous Owner | Campbell Mark | $45,000 | |
| Previous Owner | Campbell Mark | $140,967 |
Source: Public Records
Tax History
| Year | Tax Paid | Tax Assessment Tax Assessment Total Assessment is a certain percentage of the fair market value that is determined by local assessors to be the total taxable value of land and additions on the property. | Land | Improvement |
|---|---|---|---|---|
| 2025 | $8,052 | $669,900 | $178,700 | $491,200 |
| 2024 | $7,703 | $607,500 | $154,200 | $453,300 |
| 2023 | $7,295 | $526,700 | $135,100 | $391,600 |
| 2022 | $7,467 | $491,900 | $136,500 | $355,400 |
| 2021 | $4,029 | $456,200 | $136,500 | $319,700 |
| 2020 | $8,000 | $456,200 | $136,500 | $319,700 |
| 2019 | $269 | $356,100 | $136,500 | $219,600 |
| 2018 | $5,215 | $315,100 | $136,500 | $178,600 |
| 2017 | $5,000 | $303,000 | $119,800 | $183,200 |
| 2016 | $4,939 | $296,100 | $119,800 | $176,300 |
| 2015 | $4,785 | $286,900 | $119,800 | $167,100 |
| 2014 | $4,596 | $272,300 | $114,500 | $157,800 |
Source: Public Records
Map
Nearby Homes
Your Personal Tour Guide
Ask me questions while you tour the home.