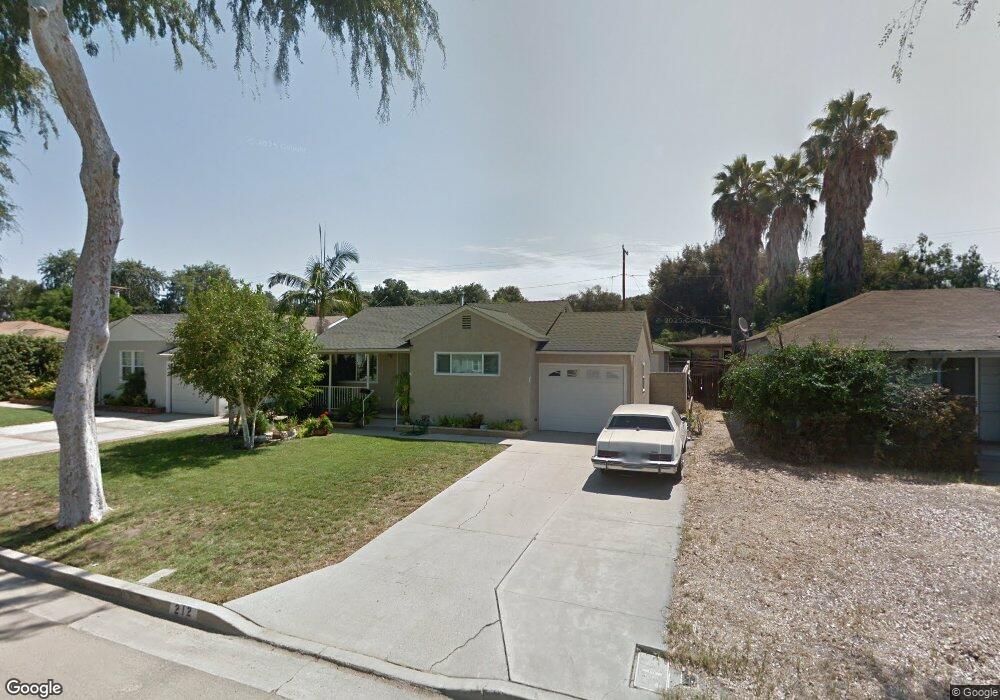
212 Adlena Dr Fullerton, CA 92833
Estimated Value: $783,000 - $919,000
2
Beds
1
Bath
873
Sq Ft
$969/Sq Ft
Est. Value
About This Home
This home is located at 212 Adlena Dr, Fullerton, CA 92833 and is currently estimated at $845,683, approximately $968 per square foot. 212 Adlena Dr is a home located in Orange County with nearby schools including Fern Drive Elementary School, D. Russell Parks Junior High School, and Sunny Hills High School.
Ownership History
Date
Name
Owned For
Owner Type
Purchase Details
Closed on
Feb 11, 2015
Sold by
Valle Monalee
Bought by
Valle Mona Lee and Gliffe William E
Current Estimated Value
Purchase Details
Closed on
Aug 5, 2013
Sold by
Valle Mona Lee
Bought by
Valle Mona Lee and The Mona Lee Valle Revocable Trust
Purchase Details
Closed on
Jun 13, 2011
Sold by
Adlena Partnership
Bought by
Valle Mona Lee and Gliffe William
Purchase Details
Closed on
Apr 11, 2011
Sold by
Graham David A and Graham Christine
Bought by
Adlena Partnership
Purchase Details
Closed on
Oct 7, 2003
Sold by
Ripberger Anne Marie and Smith Carole Leigh
Bought by
Graham David A and Graham Christine
Home Financials for this Owner
Home Financials are based on the most recent Mortgage that was taken out on this home.
Original Mortgage
$192,000
Interest Rate
6.99%
Mortgage Type
Purchase Money Mortgage
Create a Home Valuation Report for This Property
The Home Valuation Report is an in-depth analysis detailing your home's value as well as a comparison with similar homes in the area
Home Values in the Area
Average Home Value in this Area
Purchase History
| Date | Buyer | Sale Price | Title Company |
|---|---|---|---|
| Valle Mona Lee | -- | None Available | |
| Valle Mona Lee | -- | None Available | |
| Valle Mona Lee | $285,000 | None Available | |
| Adlena Partnership | $204,500 | Accommodation | |
| Graham David A | $240,000 | Commerce Title |
Source: Public Records
Mortgage History
| Date | Status | Borrower | Loan Amount |
|---|---|---|---|
| Previous Owner | Graham David A | $192,000 | |
| Closed | Graham David A | $48,000 |
Source: Public Records
Tax History Compared to Growth
Tax History
| Year | Tax Paid | Tax Assessment Tax Assessment Total Assessment is a certain percentage of the fair market value that is determined by local assessors to be the total taxable value of land and additions on the property. | Land | Improvement |
|---|---|---|---|---|
| 2025 | $4,136 | $365,131 | $313,424 | $51,707 |
| 2024 | $4,136 | $357,972 | $307,278 | $50,694 |
| 2023 | $4,033 | $350,953 | $301,253 | $49,700 |
| 2022 | $4,002 | $344,072 | $295,346 | $48,726 |
| 2021 | $3,932 | $337,326 | $289,555 | $47,771 |
| 2020 | $3,909 | $333,868 | $286,586 | $47,282 |
| 2019 | $3,810 | $327,322 | $280,967 | $46,355 |
| 2018 | $3,752 | $320,904 | $275,457 | $45,447 |
| 2017 | $3,764 | $314,612 | $270,056 | $44,556 |
| 2016 | $3,688 | $308,444 | $264,761 | $43,683 |
| 2015 | $3,587 | $303,811 | $260,784 | $43,027 |
| 2014 | $3,484 | $297,860 | $255,675 | $42,185 |
Source: Public Records
Map
Nearby Homes
- 1814 W Jacaranda Place
- 1478 W Valencia Dr
- 1636 W Valencia Dr
- 1448 W West Ave
- 830 Delphine Place
- 1201 W Valencia Dr Unit 138
- 1201 W Valencia Dr Unit SPC 201
- 1201 W Valencia Dr Unit 146
- 1201 W Valencia Dr Unit 225
- 751 Stephens Ave
- 600 S Brookhurst Rd
- 308 N Sweet Ave
- 774 Stephens Ave
- 619 S Brookhurst Rd
- 1301 W Fern Dr
- 1107 Norby Ln
- 1746 W Southgate Ave
- 2127 W Ash Ave
- 433 435 N Basque
- 1324 W Porter Ave
- 208 Adlena Dr
- 216 Adlena Dr
- 204 Adlena Dr
- 220 Adlena Dr
- 217 Martha Place
- 211 Martha Place
- 221 Martha Place
- 205 Martha Place
- 200 Adlena Dr
- 224 Adlena Dr
- 213 Adlena Dr
- 217 Adlena Dr
- 225 Martha Place
- 209 Adlena Dr
- 221 Adlena Dr
- 201 Martha Place
- 205 Adlena Dr
- 228 Adlena Dr
- 225 Adlena Dr
- 231 Martha Place