
Estimated payment $1,648/month
Highlights
- Dining Room Seats More Than Twelve
- Private Lot
- Solid Surface Countertops
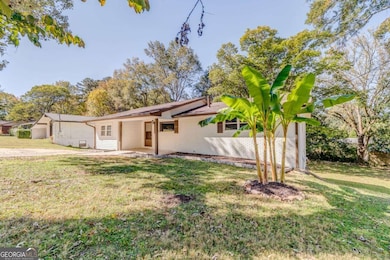
- Deck
- 2-Story Property
- No HOA
About This Home
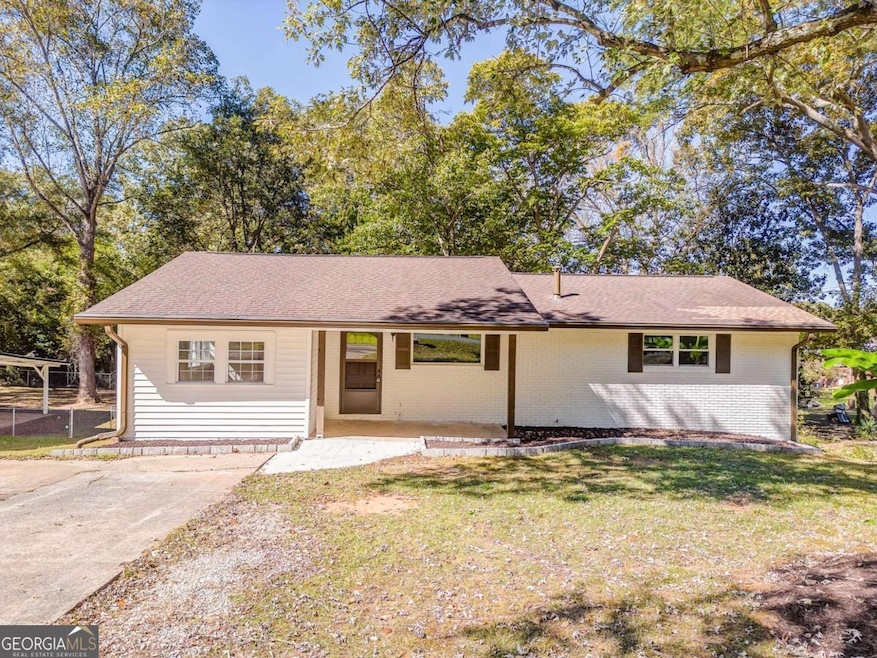
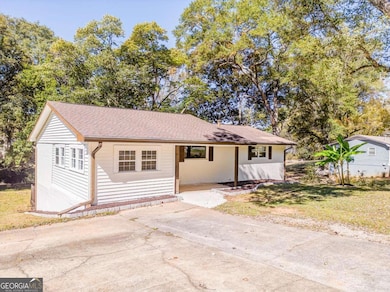
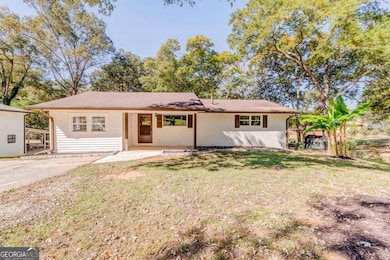
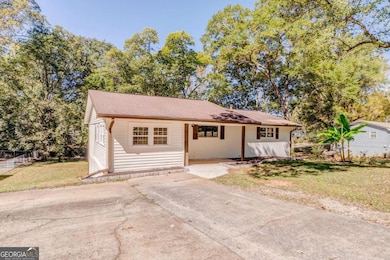
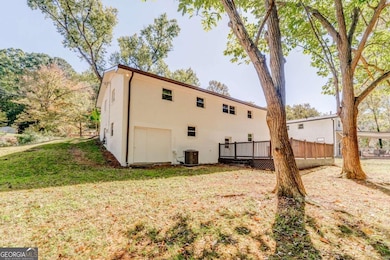
Bring your buyers to see this fantastically updated 2100sf +/- ranch on basement home, located just 6 minutes from downtown Rome, GA. This home has been completely updated from top to bottom, and features 3 bedrooms, 2 full bathrooms, PLUS a finished basement with space for a separate living room, and two extra bedroom sized flex spaces. Prefer the outdoor life? What about a private back deck to sip your coffee in the mornings? The basement has both interior and exterior access, making it ideal for an in-law suite, roommate rental, giant bonus space, or an epic master suite. This home has a ton of new features, with the following items completed in September/October of 2025: - New soft close kitchen cabinets and drawers, new granite countertops with undermount sink and faucet, new stainless steel dishwasher, stainless steel microwave and matching stove, new light fixtures and fans, new bathroom vanities and faucets, new bathtubs and shower units, new high quality LVP flooring throughout, and a new water heater. The HVAC system (both interior and exterior units) are approximately 3 years old, and the roof is estimated to be 10-12 years old with plenty of life remaining. New trim has been installed, and the whole house has been tastefully decorated with fresh paint inside and out. This home is essentially brand new and move in ready TODAY. What more could you ask for?! Don't delay and make your offer now! Property is owned by an LLC entity of which the listing agent is part owner.
Home Details
Home Type
- Single Family
Est. Annual Taxes
- $822
Year Built
- Built in 1965 | Remodeled
Lot Details
- 0.3 Acre Lot
- Private Lot
Parking
- Parking Pad
Home Design
- 2-Story Property
- Brick Exterior Construction
- Slab Foundation
- Composition Roof
Interior Spaces
- 2,066 Sq Ft Home
- Ceiling Fan
- Dining Room Seats More Than Twelve
- Formal Dining Room
- Home Office
- Laminate Flooring
- Laundry Room
Kitchen
- Convection Oven
- Cooktop
- Microwave
- Dishwasher
- Solid Surface Countertops
Bedrooms and Bathrooms
- Walk-In Closet
- Double Vanity
- Soaking Tub
Finished Basement
- Exterior Basement Entry
- Finished Basement Bathroom
- Laundry in Basement
Outdoor Features
- Deck
Schools
- Pepperell Primary/Elementary School
- Pepperell Middle School
- Pepperell High School
Utilities
- Central Heating and Cooling System
- Cable TV Available
Community Details
Overview
- No Home Owners Association
- Rosemont Park Subdivision
Recreation
- Park
Map
Home Values in the Area
Average Home Value in this Area
Tax History
| Year | Tax Paid | Tax Assessment Tax Assessment Total Assessment is a certain percentage of the fair market value that is determined by local assessors to be the total taxable value of land and additions on the property. | Land | Improvement |
|---|---|---|---|---|
| 2024 | $1,408 | $89,708 | $7,181 | $82,527 |
| 2023 | $1,342 | $85,630 | $6,528 | $79,102 |
| 2022 | $1,004 | $64,304 | $5,222 | $59,082 |
| 2021 | $840 | $54,391 | $5,222 | $49,169 |
| 2020 | $730 | $48,427 | $3,917 | $44,510 |
| 2019 | $529 | $42,408 | $3,917 | $38,491 |
| 2018 | $452 | $39,787 | $3,917 | $35,870 |
| 2017 | $435 | $38,261 | $3,917 | $34,344 |
| 2016 | $481 | $40,676 | $3,880 | $36,796 |
| 2015 | $453 | $40,676 | $3,880 | $36,796 |
| 2014 | $453 | $40,676 | $3,880 | $36,796 |
Property History
| Date | Event | Price | List to Sale | Price per Sq Ft |
|---|---|---|---|---|
| 10/21/2025 10/21/25 | For Sale | $299,000 | -- | $145 / Sq Ft |
Purchase History
| Date | Type | Sale Price | Title Company |
|---|---|---|---|
| Limited Warranty Deed | $182,000 | -- | |
| Warranty Deed | -- | -- | |
| Deed | $36,900 | -- | |
| Deed | $30,100 | -- | |
| Deed | -- | -- | |
| Deed | $34,500 | -- | |
| Deed | $17,500 | -- | |
| Deed | -- | -- |
Mortgage History
| Date | Status | Loan Amount | Loan Type |
|---|---|---|---|
| Open | $200,000 | New Conventional |
Source: Georgia MLS
MLS Number: 10628725
APN: J15Y-422
Disclaimer: Certain information contained herein is derived from information provided by parties other than Homes.com. All information provided is deemed reliable, but is not guaranteed to be accurate and should be independently verified.
![]() The data relating to real estate for sale on this web site comes in part from the Broker Reciprocity Program of Georgia MLS. Real estate listings held by brokerage firms other than Redfin are marked with the Broker Reciprocity logo and detailed information about them includes the name of the listing brokers. Information deemed reliable but not guaranteed. Copyright 2025 Georgia MLS. All rights reserved.
The data relating to real estate for sale on this web site comes in part from the Broker Reciprocity Program of Georgia MLS. Real estate listings held by brokerage firms other than Redfin are marked with the Broker Reciprocity logo and detailed information about them includes the name of the listing brokers. Information deemed reliable but not guaranteed. Copyright 2025 Georgia MLS. All rights reserved.
- 211 Alfred Ave SE
- 226 Flora Ave SE
- 2523 Maple Rd SE
- 2710 Maple Rd SE
- 2508 Maple Rd SE
- 2501 Maple Rd SE
- 2812 Maple Rd SE
- 107 E Linden St SE
- 327 Flora Ave SE
- 333 Alfred Ave SE
- 3 Belmont Ct SE
- 15 Saddlebrook Dr SE
- 409 Flora Ave SE
- 0 Martha Berry Hwy Unit 7525627
- 0 Martha Berry Hwy Unit 7614774
- 0 Martha Berry Hwy Unit 10563404
- 211 Chateau Dr SE
- 109 Chateau Dr SE
- 300 Alfred Ave SE
- 313 Chateau Dr SE Unit A
- 48 Chateau Dr SE
- 50 Chateau Dr SE
- 2 Cliffview Dr SE Unit 5
- 2 Cliffview Dr SE Unit 6
- 40 Chateau Dr SE
- 35 Vocational Dr SW
- 119 Chateau Dr SE
- 113 Chateau Dr SE
- 312 E 15th Sw (Unit A) St
- 1506 Old Cave Spring Rd SW
- 240 Park Rd SW Unit C
- 84 Dodd Blvd SE Unit A
- 812 Darlington Way SW
- 3 Fair St SW Unit A
- 12 Morningside Dr SW
- 707 E 2nd Ave
- 222 Eden Valley Rd SE
- 75 Klassing St SW
